Droplet Digital PCR (ddPCR)
The science of microfluidic liquid handling for droplet digital PCR (ddPCR)
- Higher accuracy
- Higher sensitivity
- Absolute quantitation
What is digital PCR (dPCR)?
During the last decade digital-PCR (dPCR) has become one of the most prominent assays for analytical methods. dPCR carries out a single reaction within a sample as standard PCR, however, the sample is separated into a large number of partitions, and the reaction is carried out in each partition individually.
What is droplet digital PCR (ddPCR) and how does it work?
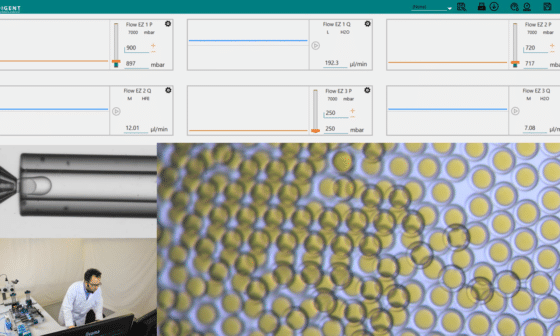
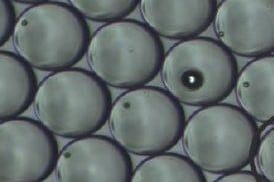
Droplet digital PCR relies on the partitioning of the tested sample into thousands of single samples thanks to the generation of droplets. For performing the assay, the sample volume is split in such a way that each droplet contains either one or none of the target DNA molecules. The droplets act as laboratory wells, each containing a sample, and being able to host a PCR reaction in within. Due to the small droplet volume, the PCR reaction runs very efficiently even from a single molecule. During amplification, a fluorescent dye is formed or activated. The positive droplets become fluorescent. Absolute quantitation of the number of target molecules is simplified to the count of fluorescence active droplets in the generated droplet collection. ddPCR is an excellent example of a transition of a microfluidic system from the academic field to industry.
What are the advantages of ddPCR?
The major advantage of droplet digital PCR is the possibility to perform absolute quantitation of the number of target molecules, which is simplified to the count of fluorescence active droplets in the generated droplet partition. The separation allows for more reliable collection and sensitive measurement of nucleic acid amounts. Precision is drastically enhanced [1], and no standard curves or calibration standards are necessary to assess the quantity of the sample of interest. The separation in multiple droplets containing nanoliters of reagent drastically reduces the time and reagents needed to perform a classical PCR reaction. This allows to reduce consumable and reagent costs, which makes it a one-of-a-kind cost effective method.
Main applications using droplet digital PCR technology
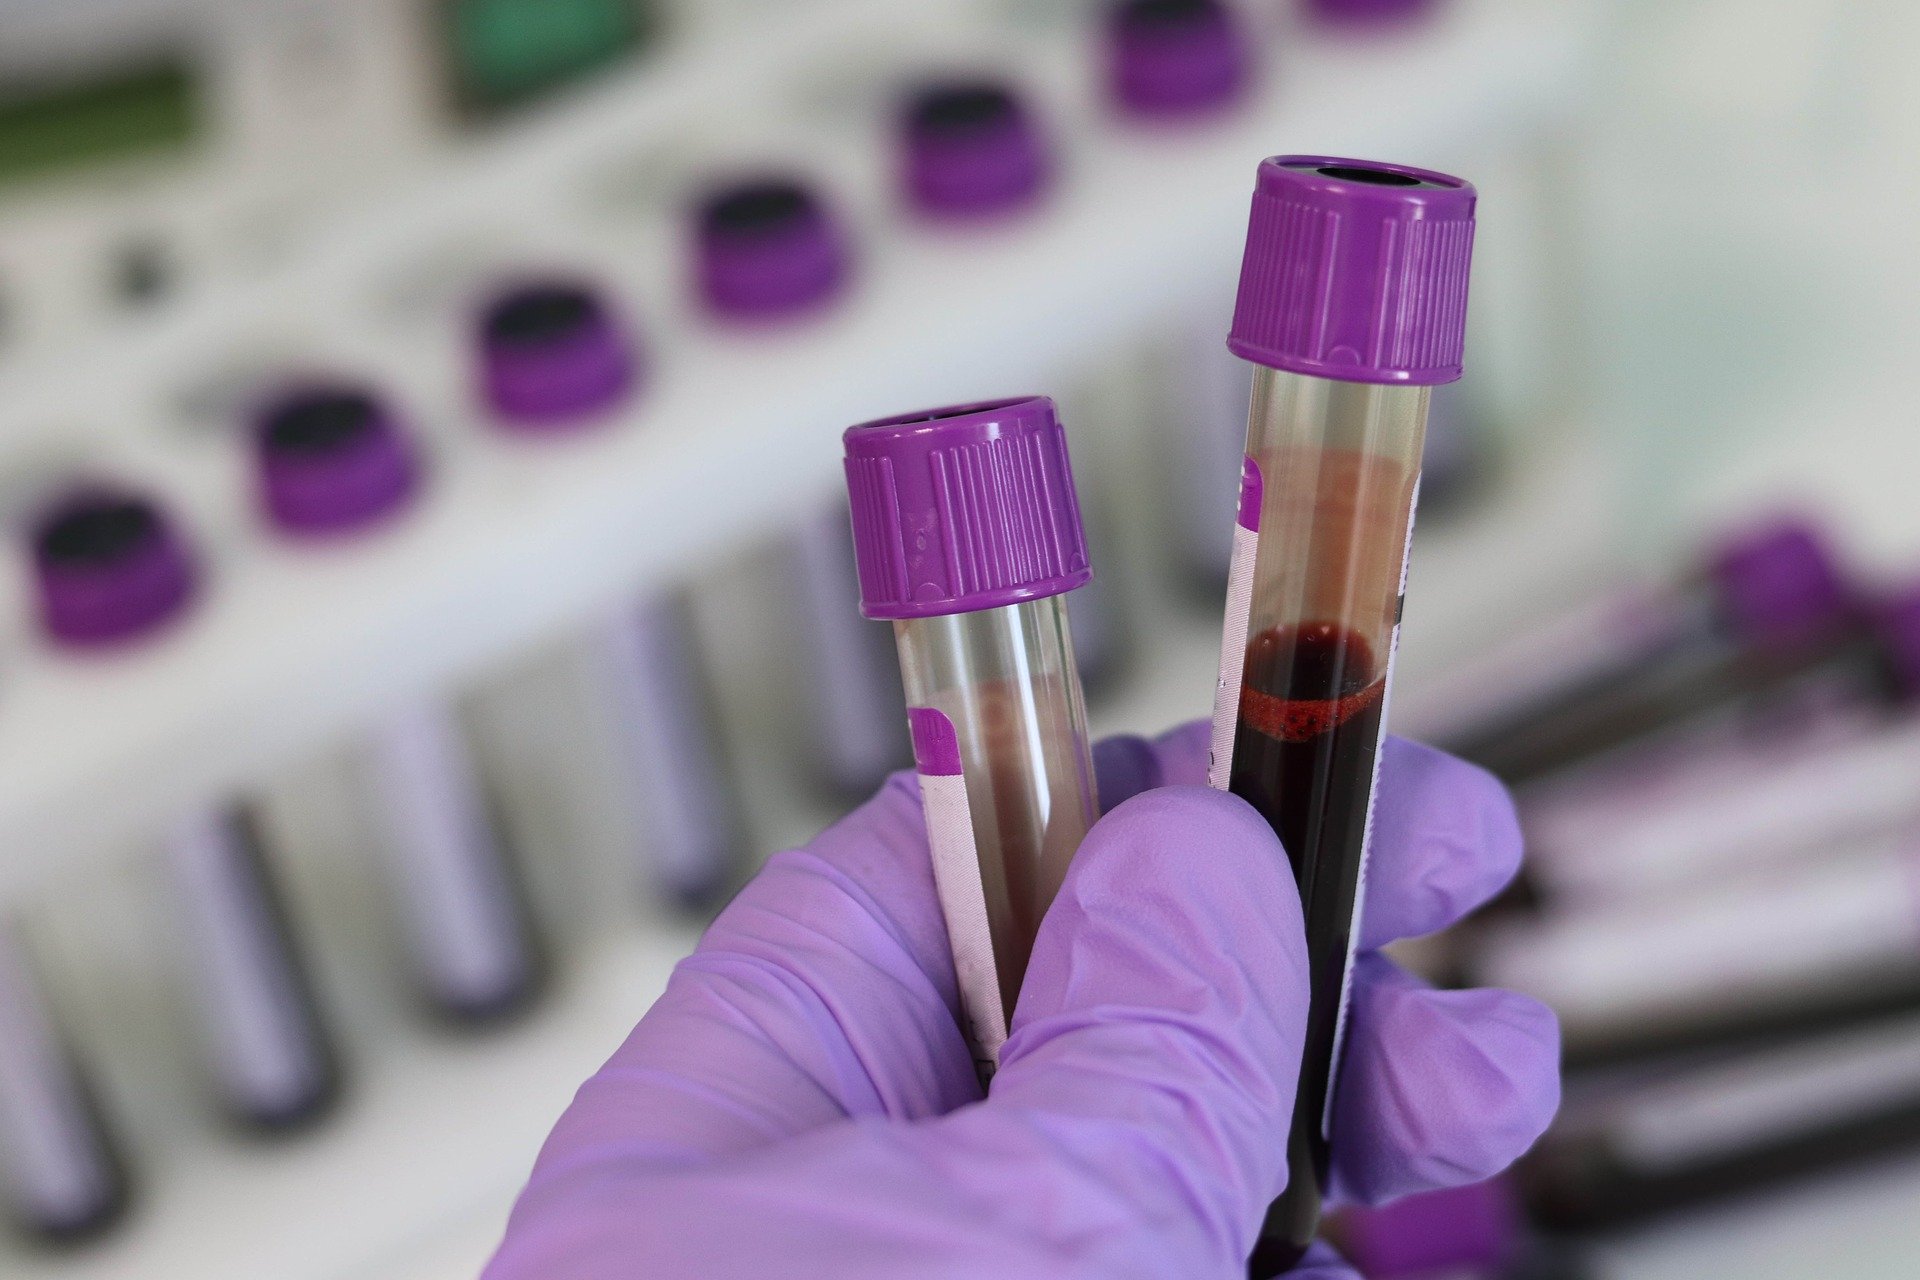
Liquid biopsy
Liquid biopsies are non-invasive tests performed on blood samples to detect cancer cells circulating in the blood (circulating tumor cells, CTCs) or pieces of DNA from tumor cells in the blood. This technique is increasingly used for cancer detection and monitoring, as it is low risk for the patient and helps doctors understand what kind of molecular changes are taking place in the tumor. Droplet Digital PCR (ddPC) provides the level of sensitivity required for liquid biopsy.
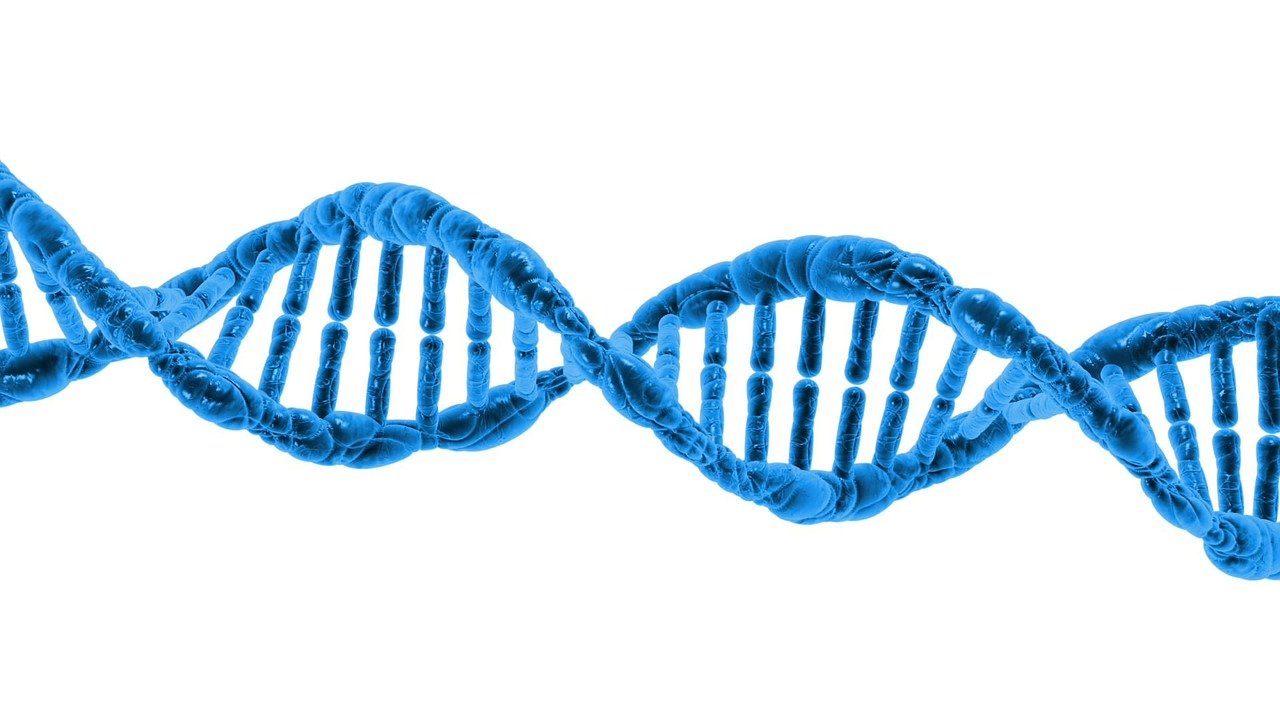
Copy number variation
A key measurement challenge in diagnostic research involves identifying small changes in nucleic acid sequence that are commonly associated with genetic diseases. Changes in the genomic DNA leading to an abnormal copy of a DNA sequence are called copy number variations (CNVs). They are present in complex diseases such as Down’s Syndrome and many cancers.
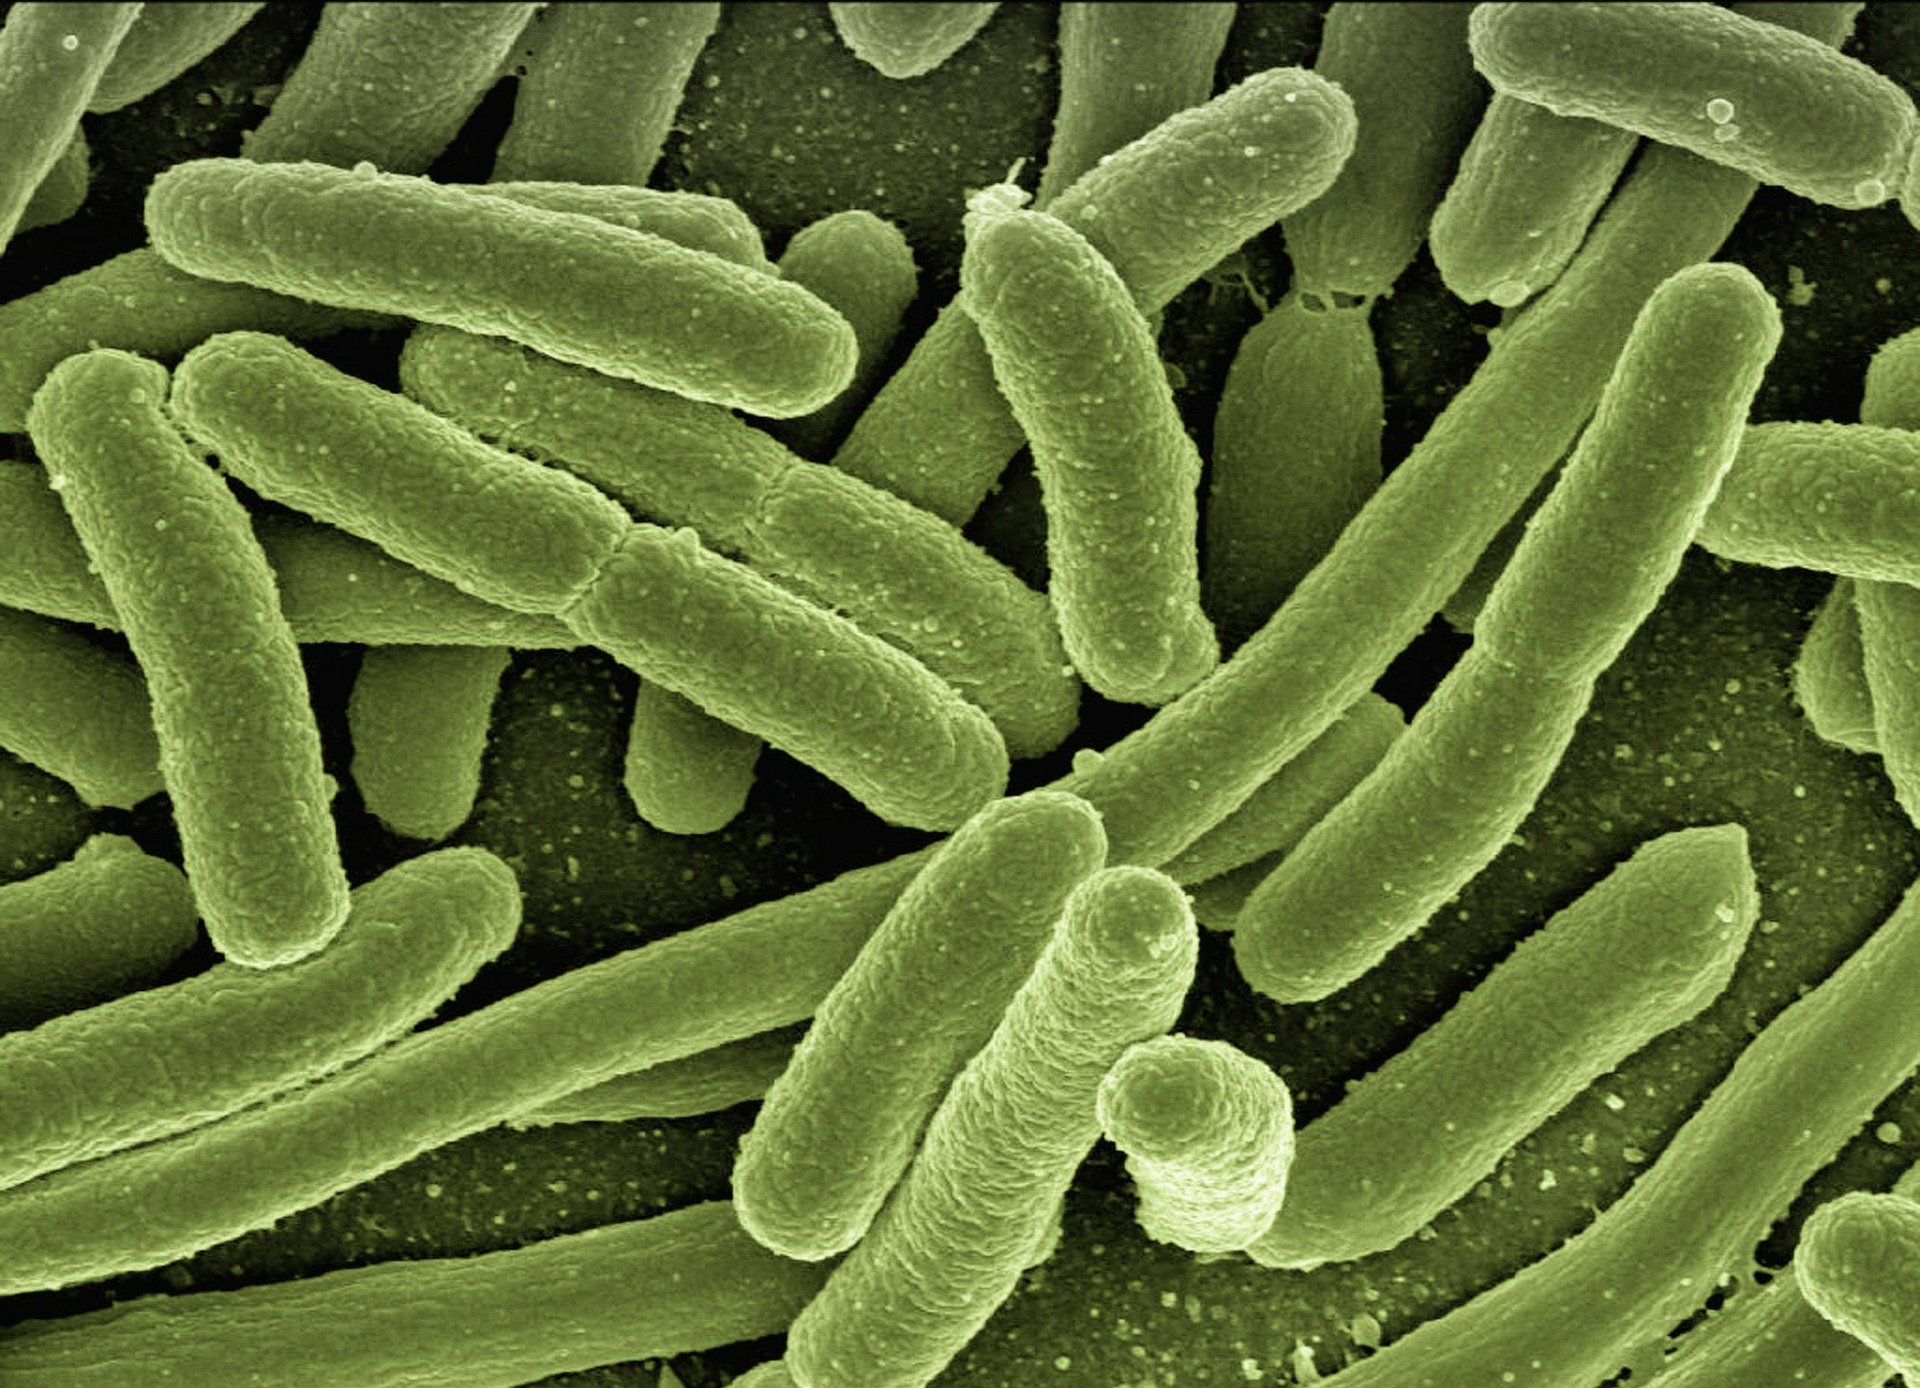
Pathogen Detection and Microbiome Analysis
Droplet digital PCR is extensively used in microbiology.. Digital PCR’s ability to amplify low concentration targets in complex backgrounds and show higher sensitivity than standard PCR makes it the technology choice for microbiome analysis.
Resources
-
Microfluidics case studies OEM Case Study: Microfluidic Drug Screening Read more
-
Expert Reviews: Basics of Microfluidics Microfluidics for vaccine development Read more
-
Microfluidic Application Notes High-throughput cell DNA screening using digital PCR Read more
-
Microfluidic Application Notes Analysis of a commercial surfactant for digital PCR assay Read more
-
Expert Reviews: Basics of Microfluidics Microfluidic Droplet Production Method Read more
-
Expert Reviews: Basics of Microfluidics Flow control for droplet generation using syringe pumps and pressure-based flow controllers Read more
Importance of fluid handling for droplet digital PCR applications
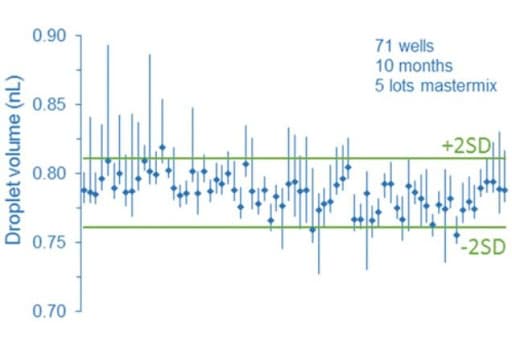
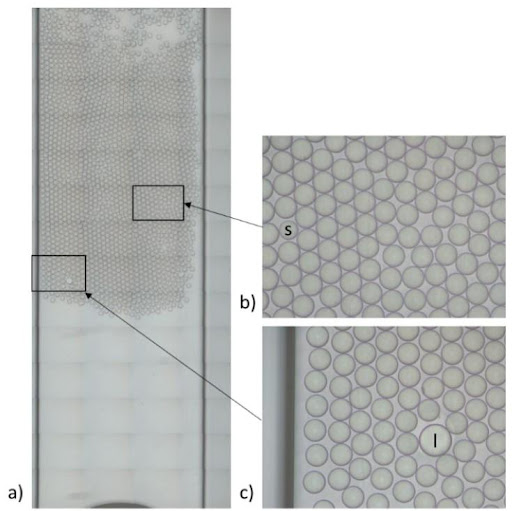
Droplet digital PCR relies on random distribution of dPCR mix containing target molecules on the partition of equivalent volumes (here, the droplets). In this way, some partitions contain no target molecules, while the remaining partitions contain at least one molecule. Partitions are next categorized and counted as positive or negative depending on their fluorescence intensity. The calculations are derived from a Poisson model, which can be impacted by partition volume since the model assumes the partition to be monodisperse. As a consequence, a heterogeneous droplet population can affect the droplet digital PCR process. In fact, several groups demonstrated through different studies that partition droplet volume variability can cause a bias on the accuracy of the measurements.
More information can be found in the paper written by Emslie et al.: Droplet Volume Variability and Impact on Digital PCR Copy Number Concentration Measurements The impact of flow rate on droplet size using a microfluidic system is today well described in the literature. Thus, to avoid heterogeneous droplet populations that can affect the droplet digital PCR process, one should consider using a precise flow controller.
Flow control systems for industrial digital PCR
Flow rate stability is thus critical for having repeatable reactor volumes and reproducible results in droplet digital PCR experiments. Syringe pumps are commonly used for generating droplets. Depending on the model in use, syringe pumps show limited flow control. As a consequence, the droplet size, proportional to the flow rate, is affected. In addition, the actual flow rate cannot be monitored with such devices. The flow rate value is displayed on the device, but no information on the time required for reaching a set flow rate is given (the time for flow equilibrium may vary depending on the microfluidic setup, and flow can oscillate depending on the instrument). An alternative to syringe pumps is pressure-based flow controllers. These show that high-precision flow control, fast reaction time, and flow monitoring are possible.
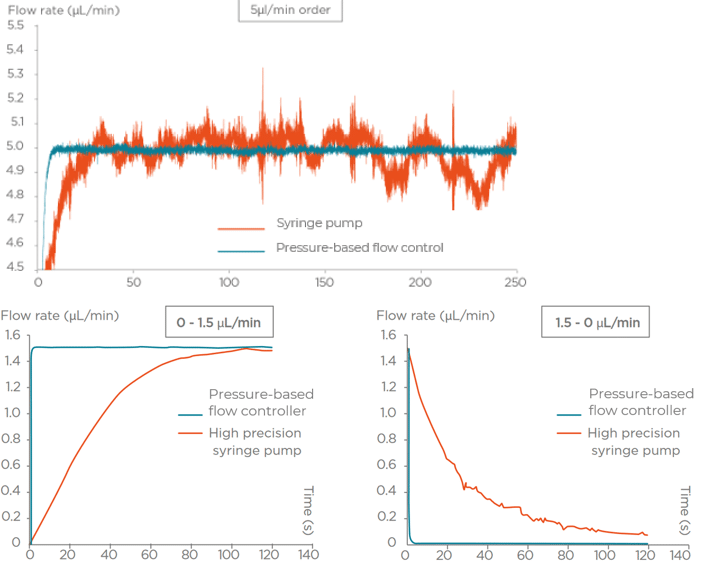

We compared the production of water-in-oil emulsions using microfluidic syringe pumps and pressure-based flow controllers. Using pressure control, the desired droplet size is quickly obtained (< 6 s), and monodisperse droplet generation is ensured over time. Thus pressure controllers are the instruments of choice for droplet digital PCR.
The benefits of choosing Fluigent for your ddPCR system
- Best in class stability: < 0.5% due to our field-proven, patented FASTAB™ technology allowing optimal flow control with the robustness required in demanding industrial environments.
- Straightforward workflow automation included in Fluigent’s software
- An expert engineering time specializing in microfluidic design and mechanical and software integration
References
1. Whale, A. S. et al. Comparison of microfluidic digital PCR and conventional quantitative PCR for measuring copy number variation. Nucleic Acids Research40, (2012).
2. Emslie, K. R. et al. Droplet volume variability and impact on digital pcr copy number concentration measurements. Analytical Chemistry91, 4124–4131 (2019).
3. Emslie, K. R. et al. Supporting information Droplet volume variability and impact on digital PCR copy number concentration measurements Author names and affiliations.
Introduction to digital PCR
What is digital PCR?
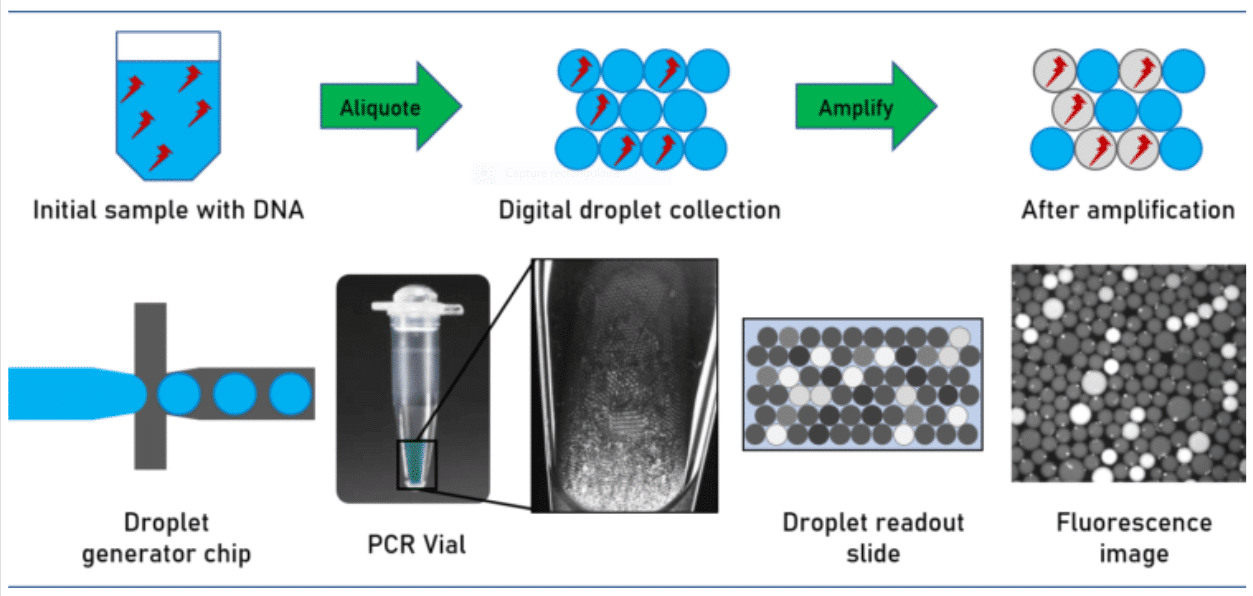
Digital droplet-based assays offer promising opportunities for the absolute quantitation of low concentration analytic species. During the last decade digital-PCR assay (dPCR) became one of the most prominent assays for this class of analytical methods.
For performing the assay, the sample volume is split into multiple droplets in such a way that each droplet contains either one or none of the target DNA molecules.
Due to the small droplet volume, the PCR reaction runs very efficiently even from a single molecule.
How does digital PCR work?
During amplification, a fluorescent dye is formed or activated. The positive droplets become fluorescent. Absolute quantitation of the number of target molecules is simplified to the count of fluorescence active droplets in the generated droplet collection. Not regarding the simplicity of the approach, its technical implementation is challenged by stabilizing the droplets collected over the complete assay avoiding unwanted droplet coalescence or crosstalk between the droplet ingredients. This has been solved by utilizing perfluorinated mineral oils as the carrier oil in combination with advanced perfluorinated surfactants, which stabilize the emulsion and avoid crosstalk and DNA exchange between the individual droplets.
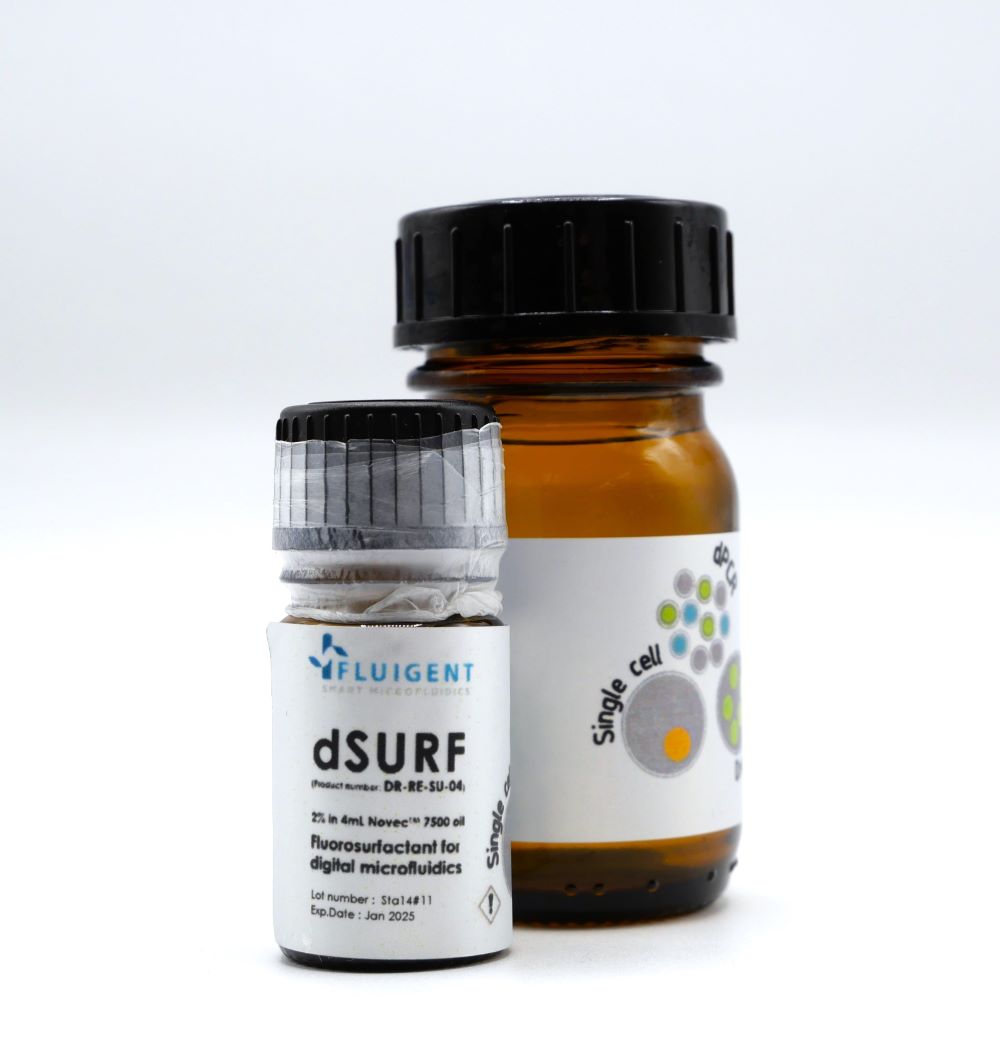
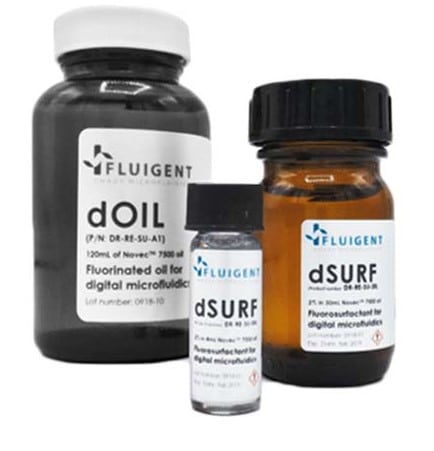
In this application note we are investigating the usability of the commercially available surfactant dSurf for an exemplary digital PCR assay.
What are the materials and equipment for digital PCR experimentation?
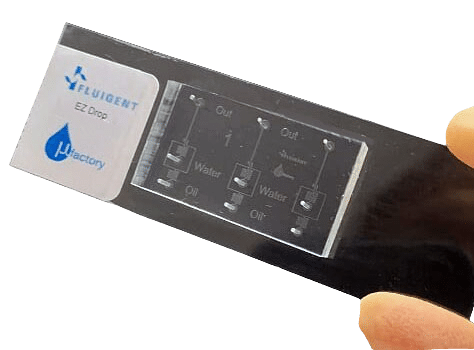
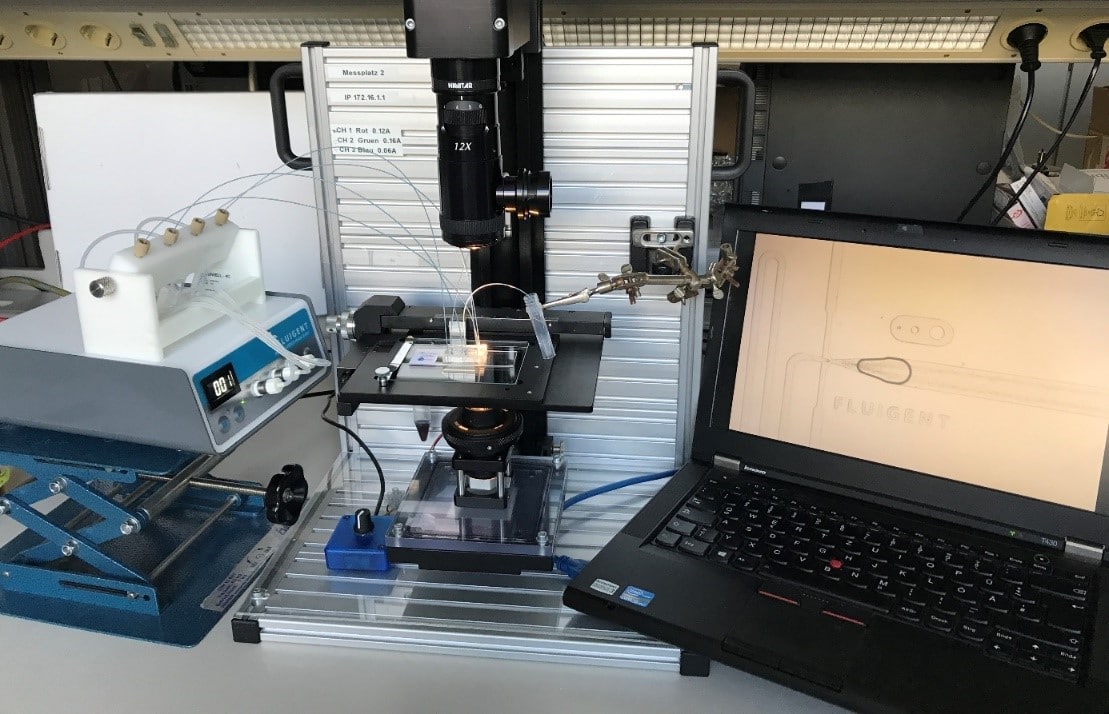
The Fluigent droplet kit was employed for the experiments, utilizing the Fluigent EZ Drop chip with three microfluidic droplet generators per chip. Interconnection between the chip and fluid reservoirs was achieved using 2m PEEK 1/32″ tubing with an outer diameter of .010″ and two sleeves with 1/16″ outer diameter, .033″ inner diameter, and 1.6″ length. More details and dimensions of the droplet generation chip can be found on the Fluigent website.
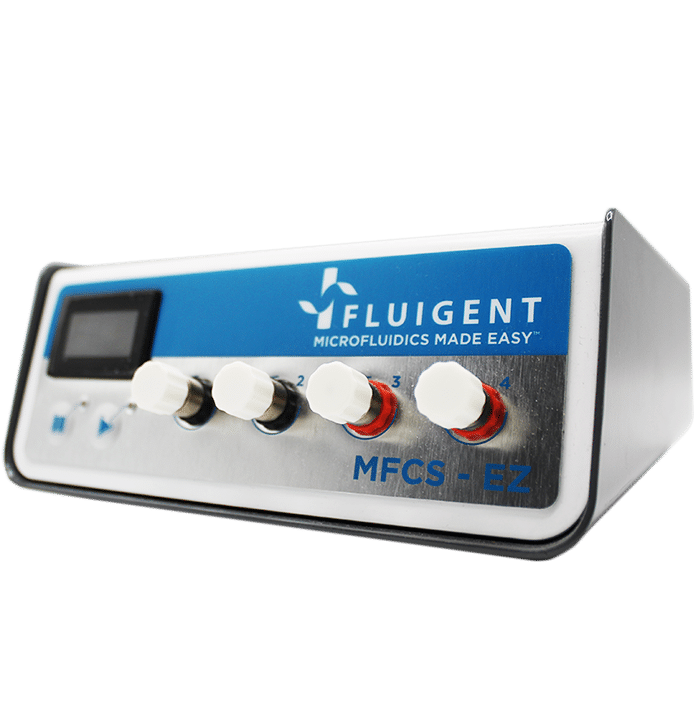
Pressure-driven flow control was managed through the “Fluigent-MFCSTM-EZ” pressure control system. DNA amplification took place using the Eppendorf Mastercycler Gradient thermocycler. For optical readout, droplets were loaded into a disposable 10 µl cell counting chamber called “Countess™” without a grid, manufactured by EVETM NanoEnTek.
Image acquisition involved a standard fluorescence microscope (Axiovert-MAT-M, Carl Zeiss AG, Germany) equipped with a Zeiss Fluar 10x magnification NA 0.5 objective, HBO 100 light source, FITC-filter set, and an Andor-Neo sCMOS camera (Oxford Instruments, Abingdon, UK) with a 5-second exposure time for fluorescence images.
What is the method of dpcr?
Droplets were generated at a working pressure of 240 mbar for the dSurf and 140 mbar for the PCR-Mix. The chip was connected with PEEK 1/32” tubing OD x .010” and 2x sleeves 1/16” OD x.033” ID x 1.6”, tubing length: 200 mm. Generated droplets were collected into a 0.2 ml PCR vial. Amplification was performed in a conventional thermocycler with the following settings:

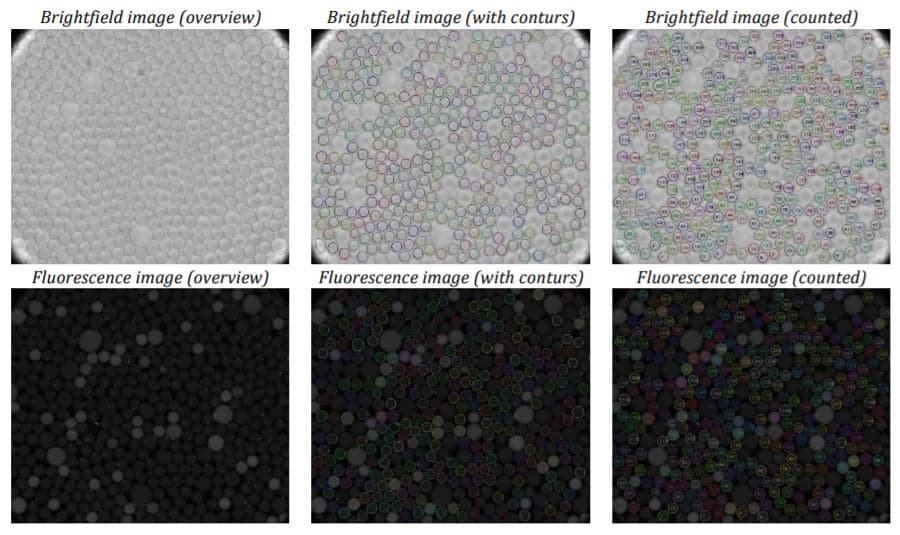
To acquire images, the amplified droplets were transferred to a cell counting chamber for brightfield and fluorescence imaging. The droplets needed to be arranged as a monolayer within the chamber for effective readout. This was achieved by loading 10 µl of the droplet suspension into a pipette tip and allowing the droplets to rise. The entire volume was then loaded into the chamber, starting with the pure fraction of the continuous phase to ensure the droplets were injected into the partially pre-filled chamber. After loading, the rear slit of the chamber was sealed with adhesive tape to minimize evaporation and prevent droplet motion or rearrangement during the readout process.
dPCR assay data analysis
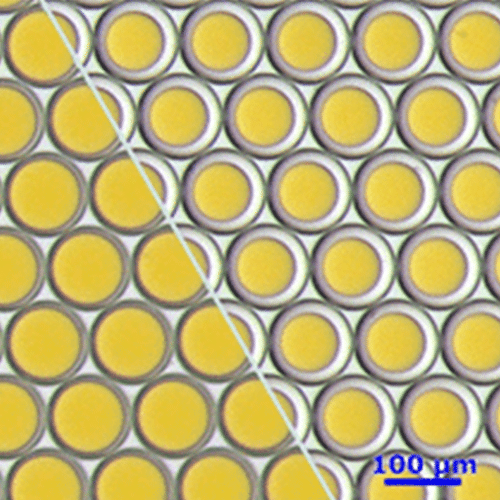
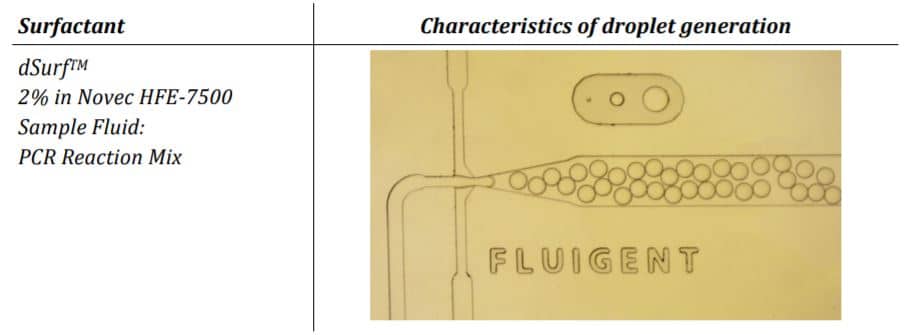
The parameter settings of the Fluigent-MFCSTM-EZ pressure control system, as described in the Materials and Methods section, were used to generate droplets for dPCR samples. Figure 2 illustrates the observed characteristics of the generated surfactant droplets, including the droplet generation regime, size, and frequency. The average droplet size was measured to be 70 µm, with a volume of 180 pL.
Conclusion
The experiments have shown that the dSurf surfactant is suitable for scientific as well as routine digital PCR applications. The generated droplets were homogeneous in shape and size. Superior droplet stability of the dSurf surfactant system was observed during the amplification process. A few droplets have dissipated during the experiments, but this can be neglected.
The reproducibility of the experiments was also confirmed. Droplet generation with identical parameters leads to identical droplet size and quality. Summarily, dSurf can be employed as a surfactant composition for digital droplet-based assays, and therefore, for digital PCR assay.
References
1. Pohl, G. and I.-M. Shih, Principle and applications of digital PCR. Expert review of molecular diagnostics, 2004. 4(1): p. 41-47.
2. Huggett, J.F., S. Cowen, and C.A. Foy, Considerations for digital PCR as an accurate molecular diagnostic tool. Clinical chemistry, 2015. 61(1): p. 79-88.
3. Quan, P.-L., M. Sauzade, and E. Brouzes, dPCR: a technology review. Sensors, 2018. 18(4): p. 1271.
Related Resources
- Microfluidics case studies
Using dSurf for High Throughput Laser-Induced Fluorescence Droplet Micro-Thermometry (LuMIn)
Discover - Interviews & Testimonials
Testimonials dSurf
Discover - Microfluidic Application Notes
E. Coli Culture in Droplets Using dSURF Fluorosurfactant
Discover - Microfluidic Application Notes
Microbiome culture in droplet using dsurf surfactant
Discover - Expertise videos
MICROFLUIDICS in DROPLET DIGITAL PCR
Discover - Microfluidic Application Notes
High-throughput cell DNA screening using digital PCR
Discover 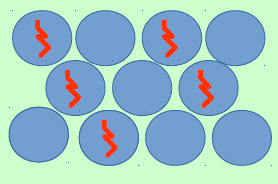
Droplet Digital PCR (ddPCR)
Discover
Introduction to DNA Screening Using Digital PCR
Polymerase Chain Reaction, or PCR, has an almost ubiquitous presence in biomedical sciences. Due to the ease of execution and the exquisite sensitivity offered by PCR, which covers amplification from a single template molecule up to about nine orders of magnitude, the applications of PCR are widespread. This includes targeted mutagenesis, DNA screening using digital PCR, virus diagnosis and analysis, and more. (1).
Droplet microfluidics offers significant advantages for performing high-throughput screens and sensitive assays. Droplets make it possible to considerably reduce sample volumes, which lowers costs. Compartmentalization in droplets increases assay sensitivity by increasing the effective concentration of rare species and decreasing the time required to reach detection thresholds. Droplet microfluidics combines these powerful features to enable previously inaccessible high-throughput screening applications, including single-cell and single-molecule assays (2).
Droplet digital PCR (ddPCR) is based on the amplification of single target DNA molecules in many separate droplets, which provides a new method for accurate quantification of DNA copy numbers. In a ddPCR assay, the distribution of target DNA molecules among the reactions follow Poisson statistics, which means that the majority of reactions contain either one or zero target DNA molecules. DdPCR has several advantages over more traditional qPCR methods.
- It enables the absolute quantification of target nucleic acid without the reliance on rate-based measurements and the need to use calibration curves.
- It demonstrates high sensitivity and precision for low-copy-number target nucleic acids. (2,3).
In this application note, the objective is to use Fluigent products to perform DNA screenings using digital PCR by isolating individual DNA molecules and analyzing the enzymes resulting from their expression.
How to perform high-throughput digital DNA screening
Materials: Products
Fluigent pressure-driven flow control solutions are ideal for high-throughput droplet generation for DNA screening, as the excellent flow stability offered by this technology ensures high droplet monodispersity, a controlled encapsulation rate, and experimental reproducibility.
Methods
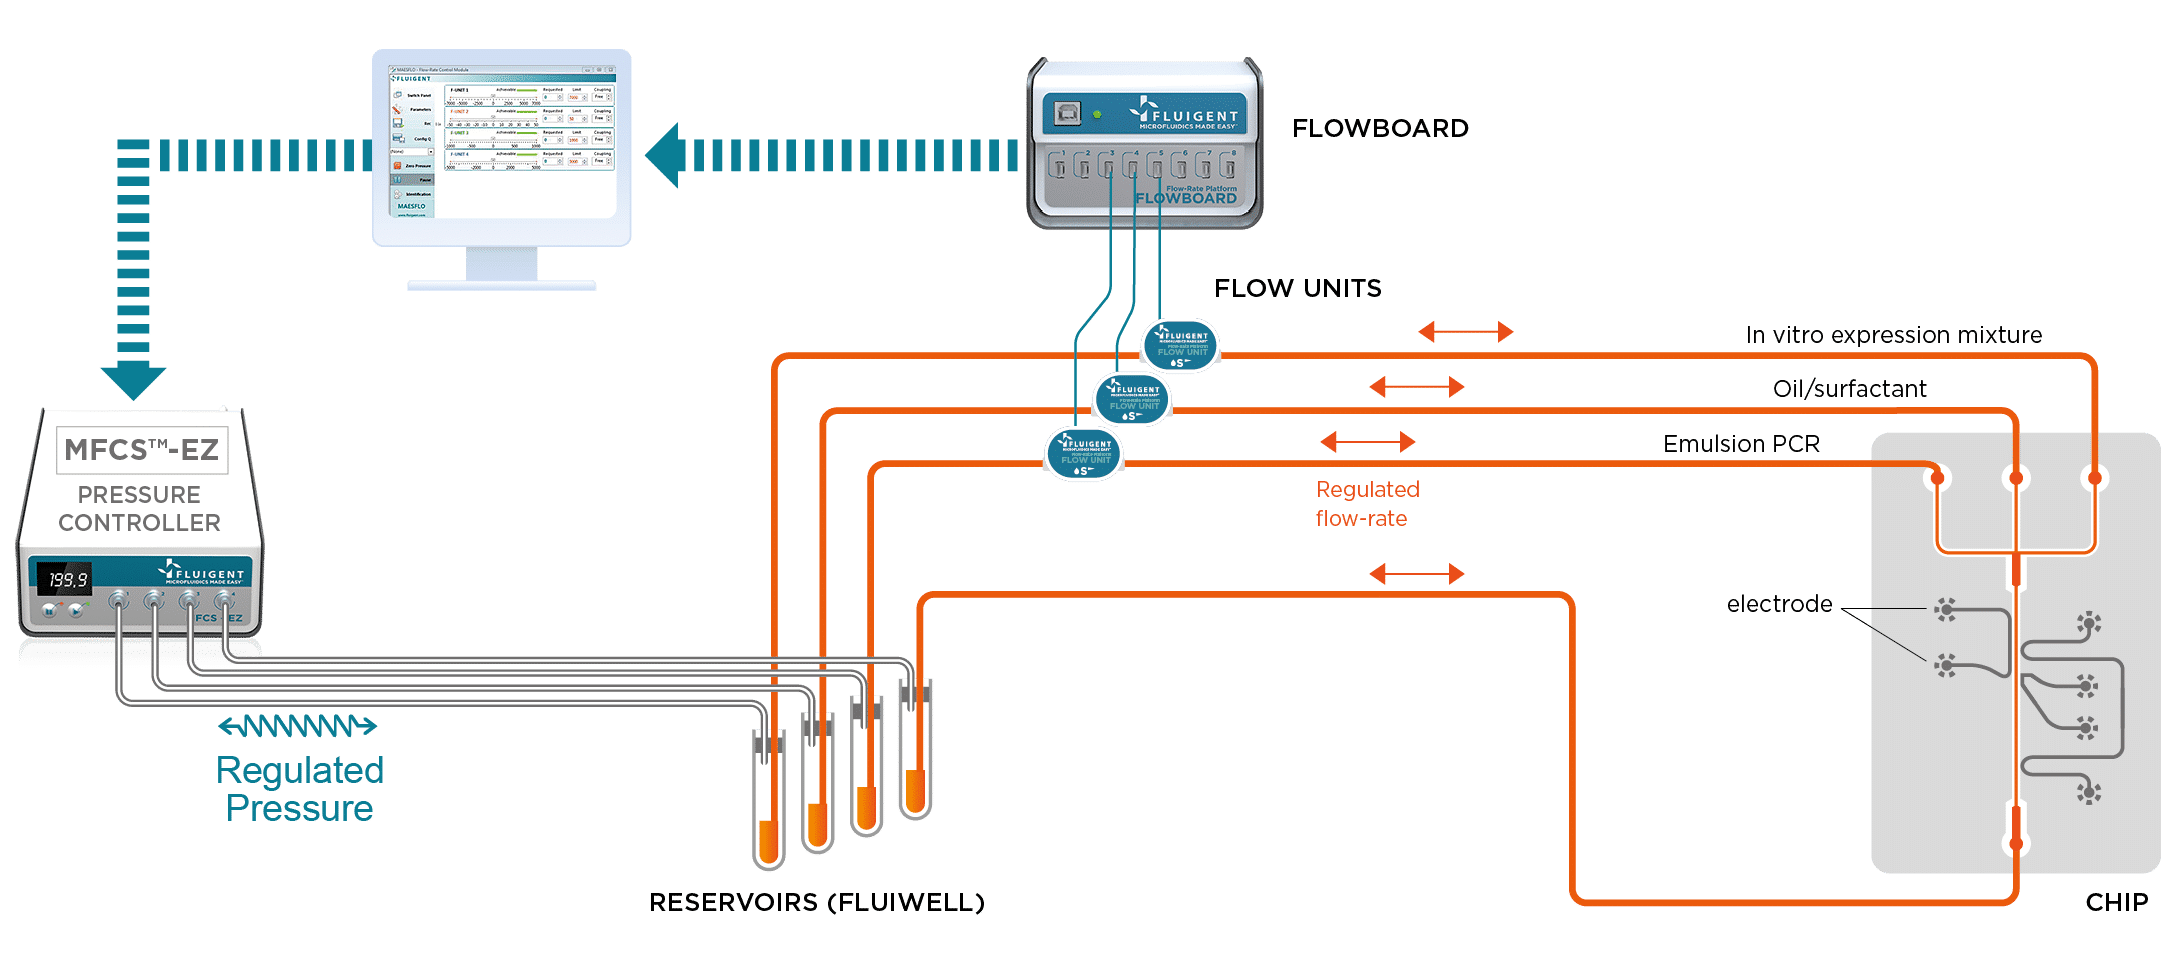
For these studies, it is important that the droplets be generated at the correct frequency and at a uniform size. Using the MFCS™-EZ in this experiment is critical, as the device generates stable flows and precise control of the different phases.
Part one: generation of the pcr/dna droplets
To perform DNA high-throughput digital screening using digital PCR, two separate emulsions were first generated. The first one encapsulated an aqueous phase of a PCR and DNA mixture in an organic continuous phase on a dedicated chip. To do this, the initial sample is injected into the microfluidic droplet generator, where it is cut into highly-monodisperse droplets by a perpendicular stream of perfluorinated oil (figure 2). Each droplet contains either one or zero molecules of DNA. The amplification step triggers the activation or production of a fluorescent dye in the droplets containing the targeted DNA. Counting the number of fluorescent droplets is equivalent to counting the number of DNA molecules.

Part two: fusion of one pcr droplet with one ivt droplet generated on a chip
A green fluorescent marker is added to the PCR primers to make them visible at the end of the process. These droplets either contain DNA to be enhanced or are empty. An orange dye is also added to measure the size of the droplet, where the intensity of the light captured by a CCD camera is proportional to the size of the droplet.
For DNA screenings using digital PCR, after amplification, the PCR droplets must be injected into a second chip. This chip generates IVT droplets, while also synchronizing them to create one PCR droplet that is inserted between two IVT droplets. The IVT droplets contain an orange dye to differentiate the contents. Fusion is processed by the application of an electric field.
Results
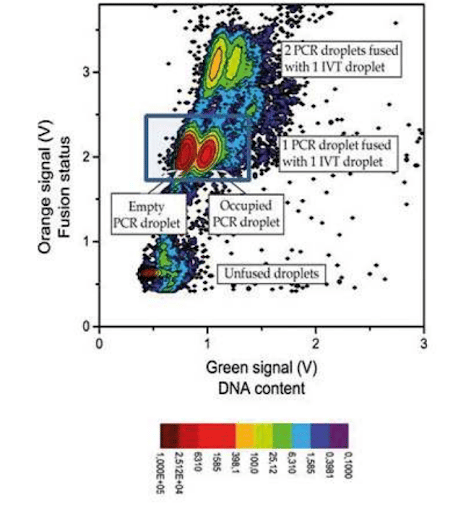
Our set-up features fast start-up and an automated configuration that allows the experiment to be performed without constant adjustments, thus saving time and enabling systemic screening. By continuously measuring the lows and pressures, the performance of the fluidic system can be evaluated at a glance, providing full control of the process.
In our experimental DNA screening using digital PCR, we obtained a 1/1 fusion at an 85% to 88% success rate (no fusion: 10%, double fusion: 5%) with stable and synchronized decays.
This graph represents a count of droplets with given orange and green signals. The darker red dot signifies a large number of droplets with these characteristics, while light blue represents a low number of droplets. The green signal shows the presence of DNA in the PCR droplet, and the orange one is relevant for detecting the occurrence of fusion.
Conclusion
To perform DNA screening using digital PCR, it is essential to have high stability in order to obtain reproducible and optimal results. Flow-rate control solutions based on pressure actuation provide:
- High droplet monodispersity (even at low low-rates over long time periods.)
- Straightforward, easily automated setup
- Precise volume and low control – even with complex, multi-channel chips to minimize cross-talk between low channels.
- Ability to detect and compensate for small disruptions such as air bubbles.
Related resources
References
- Hoshino, T. and Inagaki, F. (2012) “Molecular quantification of environmental DNA using microfluidics and digital PCR,” Systematic and Applied Microbiology, 35(6), pp. 390–395. Available at: https://doi.org/10.1016/j.syapm.2012.06.006.
- Payne, E.M. et al. (2020) “High-throughput screening by droplet microfluidics: Perspective into key challenges and future prospects,” Lab on a Chip, 20(13), pp. 2247–2262. Available at: https://doi.org/10.1039/d0lc00347f.
- Markey, A.L., Mohr, S. and Day, P.J.R. (2010) “High-throughput droplet PCR,” Methods, 50(4), pp. 277–281. Available at: https://doi.org/10.1016/j.ymeth.2010.01.030.
Download the documents
Features of Opto High-Speed Camera
Plug & Play solution
The high-speed microscope comes ready to use. It connects to a PC via a USB 3.1 cable. The device includes a fast camera with fixed optic parameters, allowing for highly reproducible results.
Ultra-compact & robust
With dimensions of only W140 x L193 x H40, the high-speed microscope is one of the most compact units available. It allows users to save bench space.
Microscopy for microfluidics
The digital camera and optics are optimized to fit with microfluidic applications. With 5X magnification, fast image acquisition of up to 1000 fps, high resolution (360LP/mm), and high contrast transmission though brightfield transmitted light (4000K), the microscope can track droplets and other fast-moving particles in microfluidic systems. The large FoV of (1.3 x 0.84 mm) and the working distance of 13 mm allow users to work with many types of microfluidic setups.
Optimized Microfluidic software
The OptoViewer software allows for visualization, photography, and video recording. The software offers many features including adjustable imaging settings (exposure time, framerate, gain, and more) and annotations, which are ideal for microfluidic experiments. In addition, the integrated droplet plug-in allows for live microfluidic droplet measurement and counting.
Related applications
High-speed microscope for microfluidics: “Track Droplet” software plugin
The OptoViewer software features a “Track Droplets” plugin. Thisallows for droplet/particle analysis. Single cells or microfluidic droplets can be automatically detected, tracked, velocity measured, and volume determined or read out inline. All statistics are displayed and can be saved.
- Droplet count
- Droplet per second
- Average droplet size
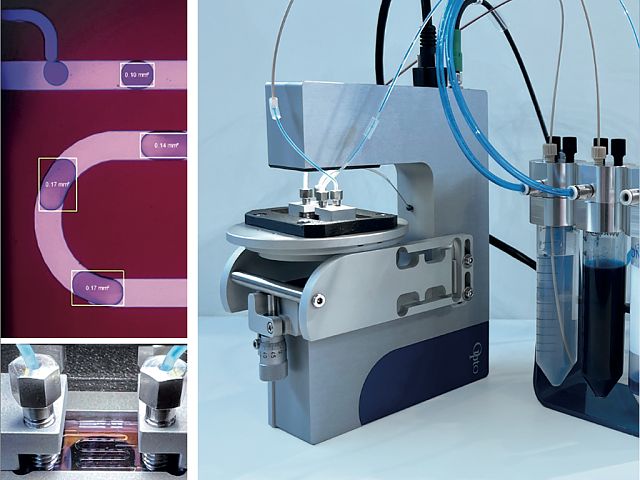
Combine with Fluigent Pressure – Flow Controllers for the most reliable results
In microfluidic devices, droplet size and generation rate are directly linked to the flow rates of the liquid solution phases . Fluigent pressure controllers provide highly stable flow rates (0.1% CV pressure, < 5% of measured flow rate value) with excellent response times (< 1s), producing highly homogenous droplets or particles for long periods of time.
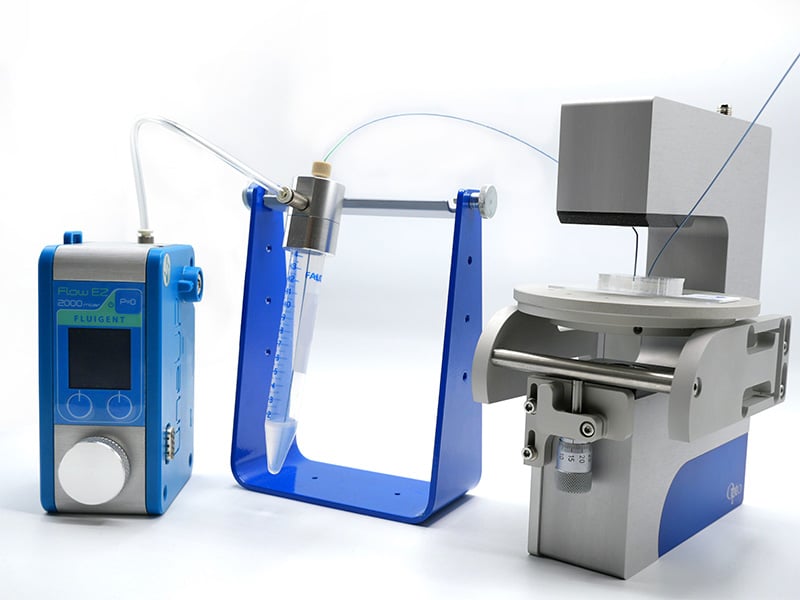
Microscopy for droplet microfluidics
Water-in-oil and oil-in-water emulsion production
An emulsion refers to a mixture of two liquids that are normally unable to mix. It consists of small droplets of one liquid suspended within another liquid. Specifically, in oil-in-water (O/W) emulsions, tiny droplets of oil are dispersed and enclosed within the continuous water phase. In water in oil (W/O) emulsions, small droplets of water are dispersed within the continuous oil phase.
These emulsion techniques, O/W and W/O are extensively utilized in various OEM and research settings to create droplets, hydrogel beads, polymer beads, or wax beads.
Fluigent has published several application notes on this topic, introducing cutting-edge technology that involves the use of a high-speed microscope. This tool enables researchers to observe the production of high-quality monodispersed droplets.
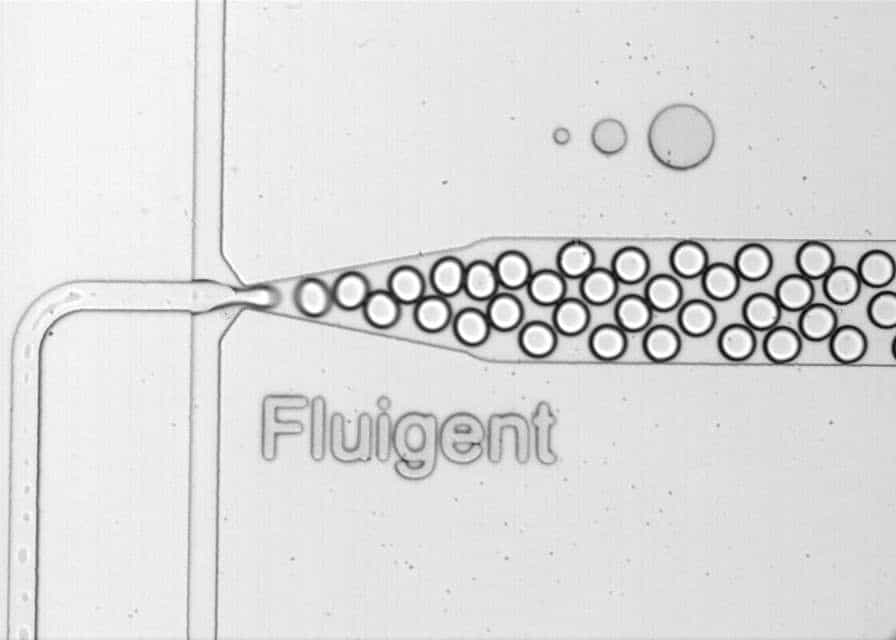
Figure 1: Water-in-oil droplets generated by Fluigent controllers and chips, visualized through the microscope.
Read our application notes:
Double emulsion production
In addition to its use in single-emulsion experiments, our fast microscope for microfluidics can also be utilized in setups involving double emulsions. The creation of double emulsions hold great promise in various academic and industrial fields. Examples include fragrance manufacturing in the cosmetics industry, food applications, drug delivery in pharmaceutics, and more.
The application note “Double Emulsion Generation” introduces Fluigent’s Double Emulsion Production Pack: a comprehensive system equipped with a microscope. This system enables the production of monodisperse double emulsions. It features the RayDrop, developed and manufactured by Secoya, to facilitate one-step production of double emulsions using a single device.
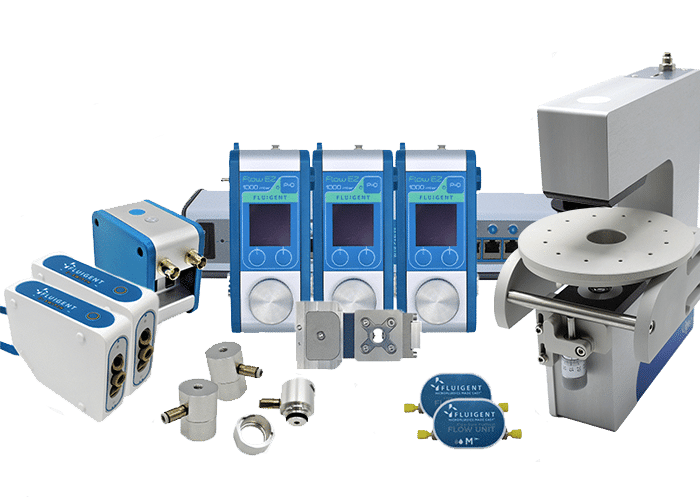
Figure 2: System setup for double emulsions
Read our application note:
Microparticles Synthesis
Fluigent technology enables the production of highly monodispersed microparticles or microcapsules. Several materials are used depending on the final application, including alginates, PLGA, or agarose microparticles. To achieve a high level of uniformity, the RayDrop is utilized as part of a microfluidic setup that includes the digital high-speed microscope.
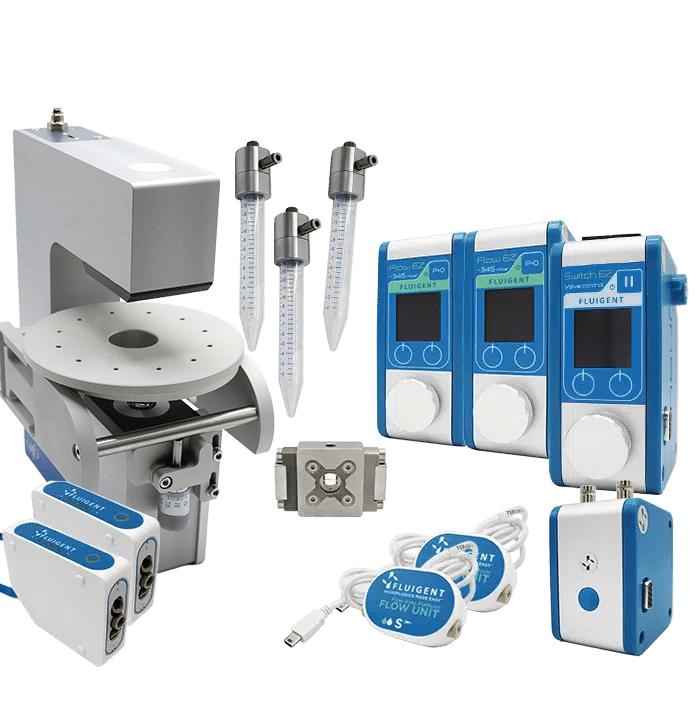
Figure 3: System for PLGA microparticle production.
See our application notes for microparticles production:

“I see great potential for our collaboration. As Opto, we can support FLUIGENT in optics, microscopy, automation, and software. Our small and compact microscopy solutions are perfect for the combination with microfluidics (compact, cost-efficient, scalable, high quality made in Germany).
The greatest benefit for the users is our free AI- based Software. It enables the recognition and tracking of objects like particles or droplets. This input is further used to control the pump. This is what makes our common package unique.”
Daniel Kraus | Product Manager Biophotonics at Opto GmbH | Project Manager at SpectroNet
Specifications Microscope
| Magnification | 5X |
| FoV [mm] | 1.3 x 0.84 |
| Resolution [LP|mm] | 360 |
| Working Distance WD [mm] | 13 |
| Object Space Resolution [μm/Pixel] | 0.7 |
| Depth of Field DoF [mm] | 0.008 |
| Sensor | IMX392LQR-C| 2.35 MP | Colour | 166 fps* *At maximum resolution. By reducing pixels area, fps can go up to ~1000fps |
| Dimensions [mm] | W140 x L193 x H40 |
| Weight [g] | 1400 |
| Interface | USB3.1 Gen 1 Type C |
| Illumination | Transmitted light | white| 4000K |
| Control Software | OptoViewer 2.0 |
| Certifications | CE / RoHS / WEEE-Reg.-No. DE 68564667 |

Markus Riedi, CEO Opto GmbH
Expertise & resources
-
Microfluidic Application Notes 1-10 microns PLGA microsphere production using the RayDrop Read more
-
Expertise Addressing Air Bubble Issues in Microfluidic Systems Read more
-
Microfluidics White Papers Double emulsion for the generation of microcapsules – a Review Read more
-
Microfluidic Application Notes Alginate Microcapsule Synthesis Read more
-
Microfluidic Application Notes Agarose Microcapsules Synthesis Read more
-
Microfluidic Application Notes PLGA microcapsules synthesis Read more
-
Microfluidics White Papers Droplet-based Microfluidics Read more
-
Fluigent Products Datasheets High-speed Microscope Datasheet Download
-
Microfluidic Application Notes Liposome Nanoparticle Synthesis Read more
-
Microfluidic Application Notes PLGA Microparticles Synthesis Read more
-
Microfluidic Application Notes Water in Oil Emulsions Read more
-
Microfluidic Application Notes Oil in Water Emulsions Read more
-
Microfluidic Application Notes Impedance Measurement of Microbeads Read more
Related products

PLGA Microparticle Production Pack (Automation Pack)
PLGA Microparticle Production Pack (Automation Pack)
See the offer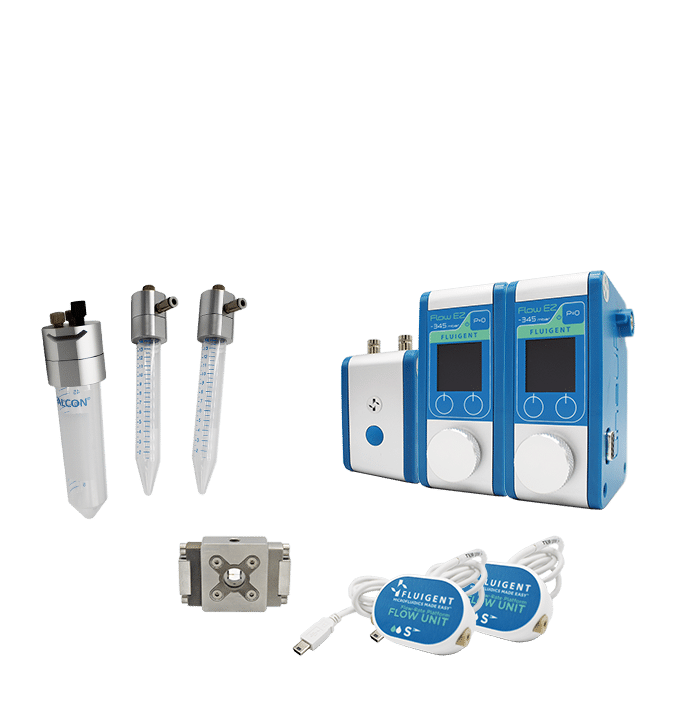
PLGA Microparticle Production Standard Pack
PLGA Microparticle Production Pack (Standard Pack)
See the offer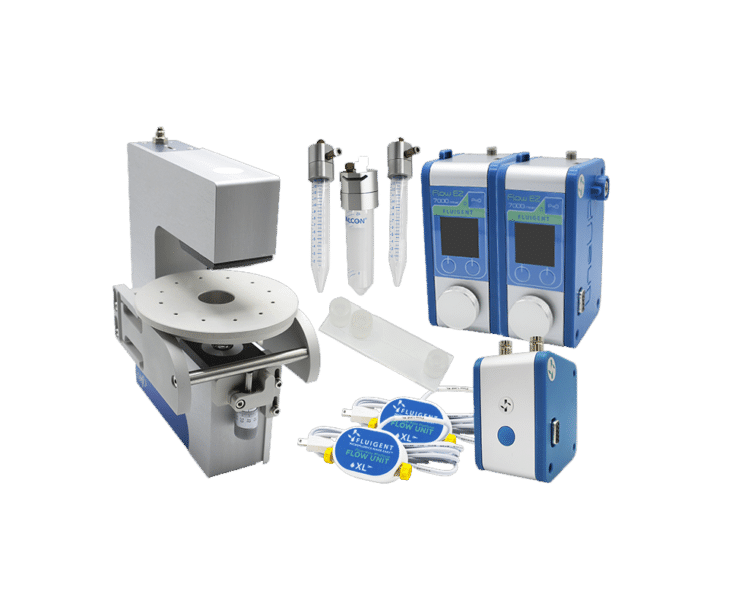
Liposome Production Pack
Produce liposomes reproducibly over the size range from 40 nm to 150 nm
See the offer
Alginate Bead Generation Pack
Alginate Bead Generation Pack
See the offer
Double Emulsion Generation Pack
Double Emulsion Generation Pack
See the offer
How to choose the right microfluidic flow control system
| Cost-effective pressure controller | Medium pressure controller | Premium pressure controller (Fluigent) | |
| Accuracy | Medium | Good | Excellent |
| Stability | Poor to medium | Medium | Excellent |
| Response time and depressurization | + | ++ | +++ |
| Sensor calibration | Not available | Not available | Available |
| PID/Algorithm performance | No (analog I/O only) | Good | Excellent |
| Ready to use | No (DAQ) | No | Yes |
| Flow sensor integration | Not available | Not available | Available |
| Flow rate regulation | No | No | Yes, through the Fluigent algorithm |
| Microfluidic valve integration and automation | No | No | Yes |
| Noise-free | No | Yes | Yes |
| Price | Low | Medium | Medium to High |
| Compatibility with microfluidics applications | Low | Medium | High |
| Typical applications | Constant pressure supply: quake valves, semiconductors | Cell culture and basic droplet microfluidics | Droplet microfluidics, cell culture (OOAC), advanced fluorescence microscopy, microfluidic spectroscopy |
Table 1: Pressure controller comparison for microfluidic applications
Microfluidic technology is widely used in academic research for a myriad of applications in life sciences, chemistry, and food. It is also becoming increasingly popular in analytical device and bioreactor industries, as it brings a new level of analysis and offers several benefits, including more reliable results while minimizing reagent consumption.
Popular scaled applications today include microfluidics for cell biology, fine perfusion, and organ on a chip studies, or droplet microfluidics for biological encapsulation (digital PCR, organoids).
Advantages of Fluid Control for Industries
In the world of microfluidics, flow control is essential for reliable results. Several technologies are available on the market, including syringe pumps, peristaltic pumps, and pressure controllers.
Pressure control is a technology of choice in microfluidics as it usually offers higher performance and reliability compared to syringe pumps. Yet all pressure controllers available on the market are not equal, with some of them not adapted to microfluidics.
Each type has its own set of features and capabilities, catering to different budget constraints and research requirements. Depending on the user requirements, one will prioritize higher performance and reliability, which often comes with higher costs, while the other will optimize price at the cost of reduced performance.
In the crowded jungle of pressure controllers and regulators, what is the best pressure controller for microfluidics?
What are the different pressure controllers?
We identified 3 different types of pressure controllers available in the market for users to choose from. We compared them in terms of cost-effectiveness and quality.
- Cost-effective pressure controllers are the most basic and affordable option. They typically have lower performance compared to the medium and premium options.
- Medium pressure controllers offer a balance between affordability and performance. They provide improved performance compared to cost-effective pressure controllers, but still find
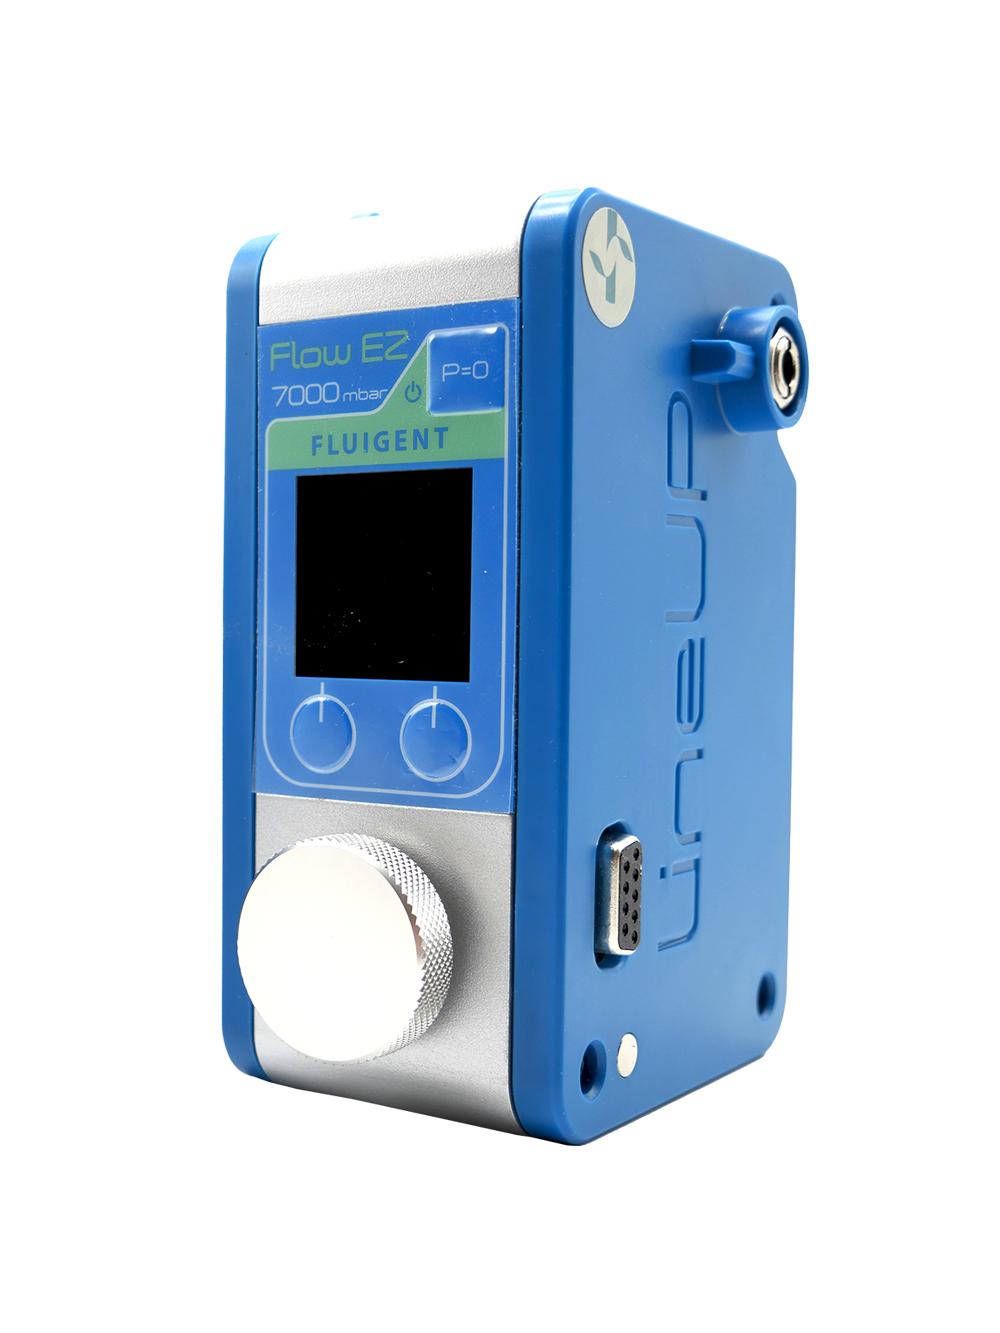
- Premium pressure controllers, as the name suggests, offer the highest level of accuracy and stability. They are designed for applications where precision and reliability are of utmost importance, which is usually the case in microfluidics. Here the pressure controllers used are the Fluigent Flow EZ and F-OEM
Firstly, we compare the 3 pressure controllers in terms of performance (accuracy, stability, response time), and next focus on usability and integration capabilities. We finally discussed the achievable applications for each device.
Choosing a pressure controller based on performance
When choosing a pressure controller, a common practice is comparing specifications listed on product technical documentation such as product datasheet or user manual. There are several important parameters to consider such as product accuracy, repeatability, or response time.
Although a good approach to eliminate products that are beyond doubt out of specifications, it is a complex exercise as some manufacturers give specifications based on the sensor or valve that compose the pressure controller, while others tend to provide data based on real tests.
In addition to specifications, what makes the general performance of a pressure controller is its regulation algorithm. In fact, basic pressure controllers only provide analog communication based on voltage, while some can provide PID controllers that allow giving live feedback loops and adjusting the pressure based on the pressure sensor feedback. It ultimately affects pressure stability, accuracy, response time, and pressure transitions.
We here do a microfluidic pressure controller comparison based on accuracy, response time, and pressure transitions for cost-effective, medium-range, and premium pressure controllers with a pressure range of 0-1 bar.
How accurate and stable is your pressure controller
Accuracy is a crucial factor to consider when choosing a pressure controller. A pressure controller with high accuracy ensures that the desired pressure setpoint is achieved. In addition, pressure stability is a crucial factor to consider when choosing a pressure controller, as many applications rely on stable pressurization processes.
We perform accuracy and stability analysis by ordering a pressure of 750 mbar, measuring with an external calibrated pressure sensor, and keeping the ordered pressure of 750 mbar for more than 10 hours.
This approach allows us to identify how the devices behave under continuous operating conditions and to detect any drift or stability issues that only become apparent during prolonged operations.
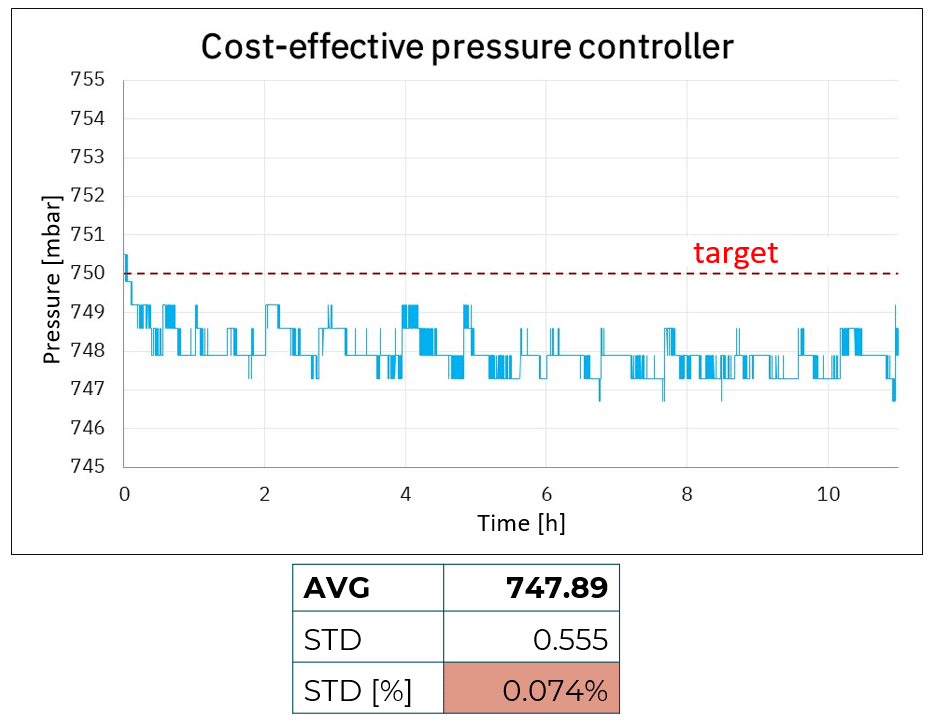
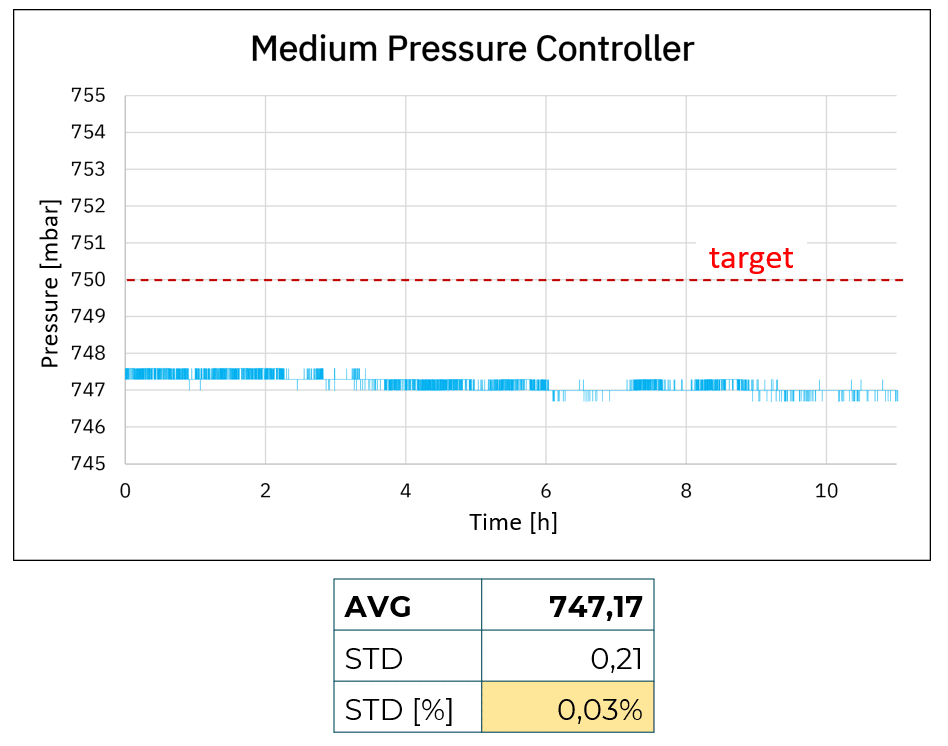
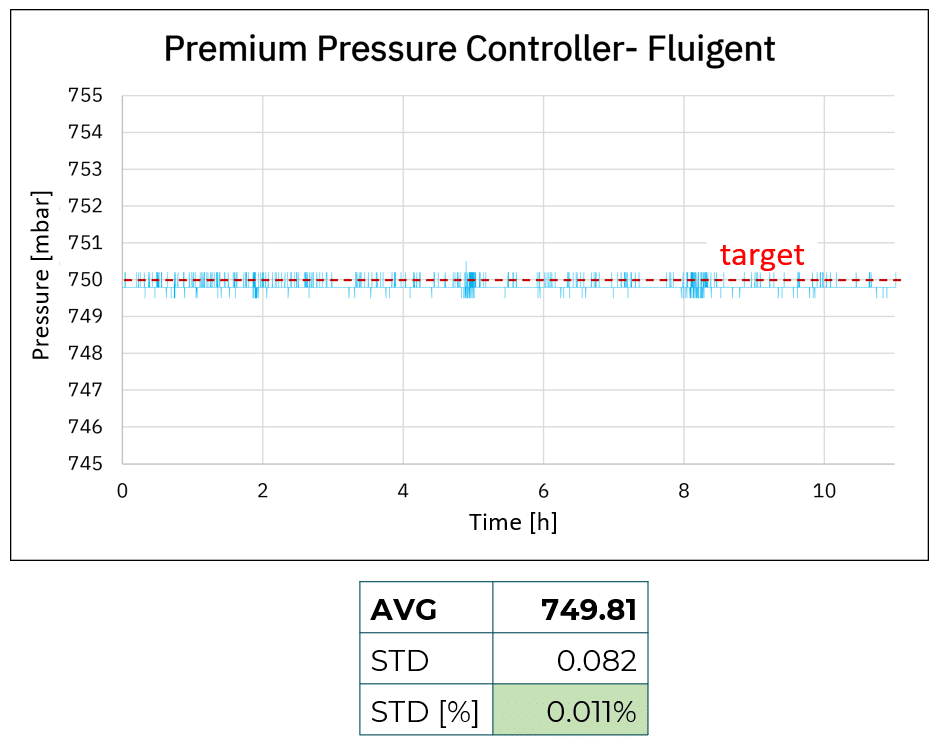
Figure 1: Accuracy and stability comparison using cost-effective, medium, and premium pressure controllers
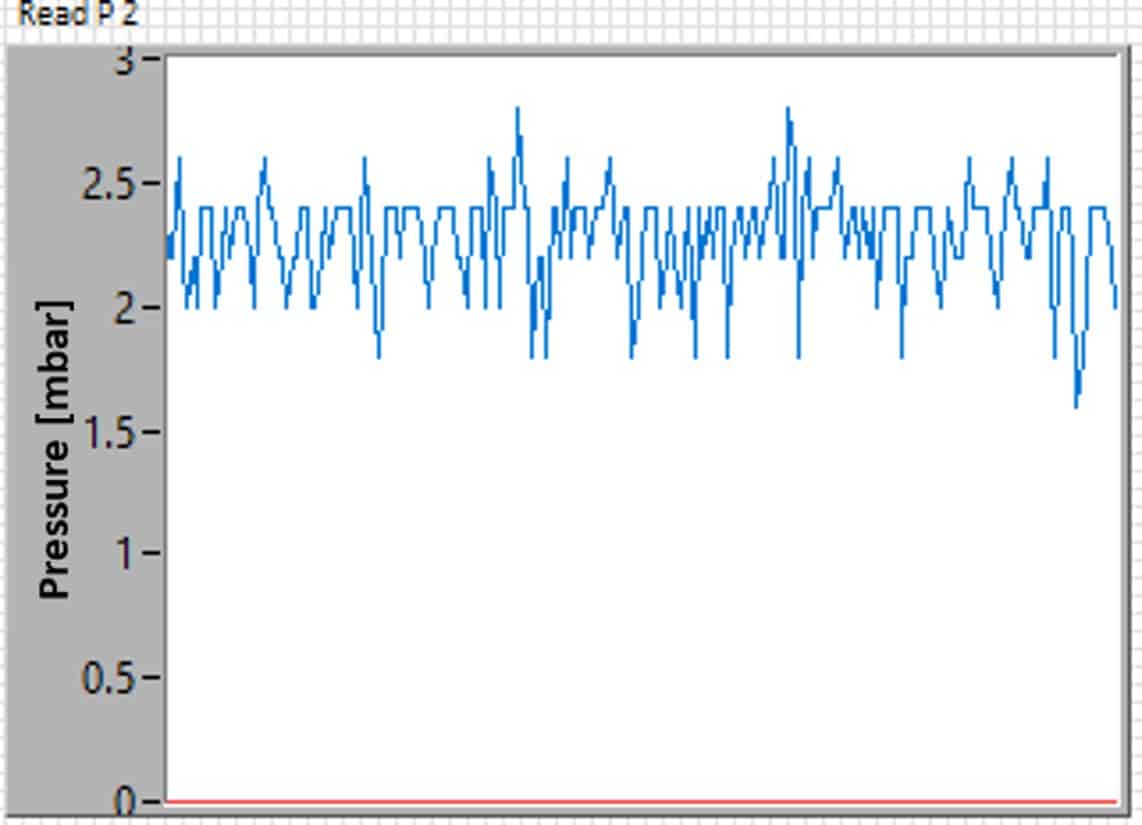
Figure 1 shows pressure accuracy and stability for the cost-effective, medium, and premium pressure controllers. Looking at the average, it is possible to see that both cost-effective and medium-pressure controllers show a shift in accuracy compared to the targeted value of 750 mbar with a difference of more than 2 mbar. This is likely linked to the fact that both products do not have live calibration capabilities, inducing a shift compared to the targeted value, ultimately generating noise (see figure 2).
Enhanced stability and accuracy over the long term with the premium system
Using the premium pressure controller, the average value is 749.81 mbar, +/- 0.082 mbar. The premium pressure controller is the most accurate device with less than 0.2 mbar shift compared to the targeted value, making it the most performant product in terms of accuracy.
Another parameter we can analyze here is stability. We observe that with the cost-effective system, 750 mbar is achieved at the start of the experiment but in less than an hour we can observe a shift in the applied pressure, transitioning from 749 mbar after ~30 min and 748 mbar after a few hours. We observe similar pressure drift with the medium pressure controller, with a lower degree of magnitude (747.5 to 747 mbar).
Utilizing the premium pressure controller, the pressure of approximately 749.8 mbar remains stable for over 8 hours without exhibiting any drifts. Additionally, we observe enhanced stability and accuracy over the long term, as it is consistently maintained within the required pressure range with commendable stability.
Response time: how fast do you want to change pressure?
Response time is another important factor to consider when choosing a pressure controller. A pressure controller with good performance will be able to quickly respond to changes in pressure and maintain stability.
The response time of a pressure controller is a critical factor in microfluidics due to the precise and often delicate nature of processes within these systems. A pressure controller with a quick and accurate response time ensures that when setpoints or external conditions change, the system can adapt rapidly and maintain the desired pressure with minimal overshot or oscillations. This is essential for maintaining the integrity of experiments or processes, as delays or inaccuracies in pressure adjustment can result in compromised data, ineffective fluid control, and potentially damage sensitive microfluidic components.
We here perform 2 response time tests: pressure increase (400 mbar -> 500 mbar) and pressure decrease (500 mbar -> 400 mbar).
We define the response time as the time to reach 98% of the targeted value and remain in a tolerance of 2% of the targeted value. Note that we cannot perform this test on the cost-effective pressure controller as it is controlled through analog I/O only and does not include a PID.
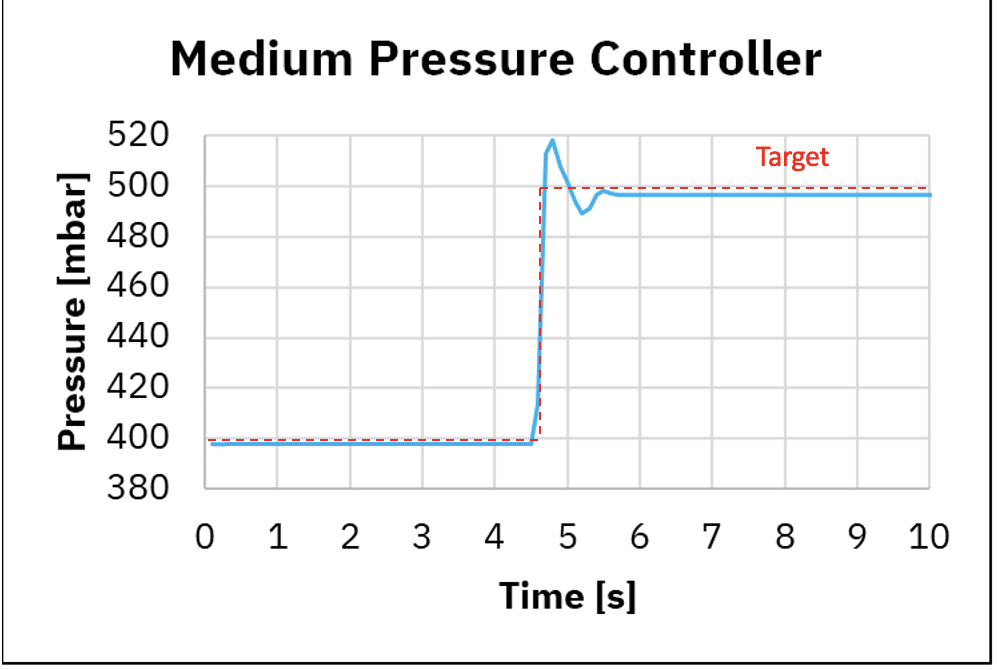
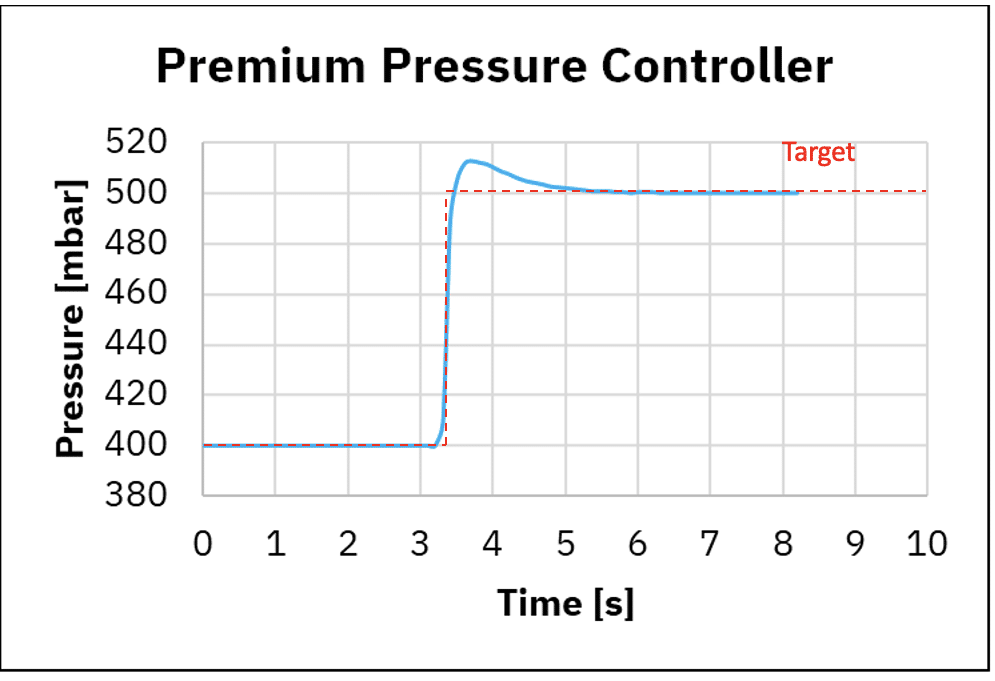
Figure 3: Response time using medium pressure controller and premium pressure controller
| Response time 400 to 500 mbar | Response time 500 to 400 mbar | |
| Medium Pressure Controller | 0.8 s | 0.7 s |
| Premium Pressure Controller | 0.8 s | 0.1 s |
Table 2: Pressure controller comparison for microfluidic applications
A Better response time with the premium fluid controller
Figure 3 shows pressurization and depressurization using the medium pressure controller and premium controller. When using the medium pressure controller, for pressurization we observe the time to reach 98% of the targeted value is 0.8 seconds while using the premium pressure controller 0.8 seconds. For depressurization we observe the time to reach 98% of the targeted value is 0.7 seconds while using the premium pressure controller 0.1 seconds.
This shows the medium pressure controller and premium pressure controller have similar response time for pressurization for a transition at 100 mbar, while depressurization is about 10 times faster with the premium pressure controller.
In addition, with the medium pressure controller, we can observe minor pressure oscillations and overshoots after reaching a stable phase, which also originates from the regulation algorithm performance.
Additionally, when one needs to stop a fluidic protocol, depressurization time will depend on the pressure controller used. Graph 4. shows the depressurization time from 500 mbar to 400 mbar using the medium and premium pressure controllers. We can observe it takes 0.7 s and 0.1 s using the medium and premium pressure controllers respectively.
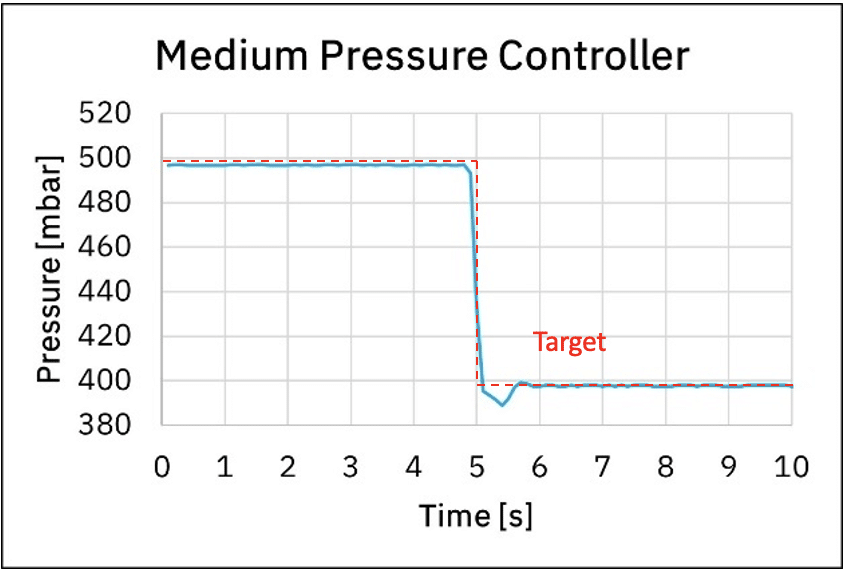
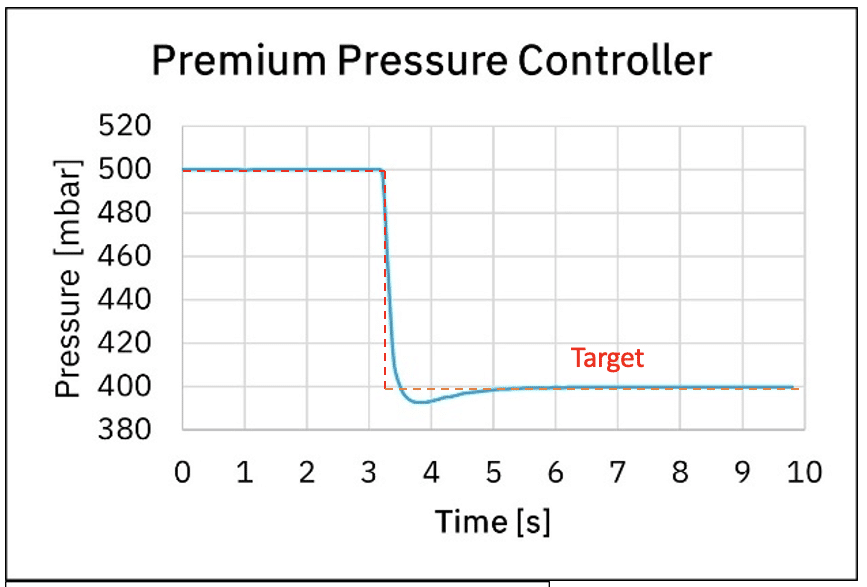
Figure 4: Response time using medium pressure controller and premium pressure controller
Depressurization time has a great impact on microfluidic protocols, as during the depressurization time liquids are still injected even though the experiment has ended. Precious liquids injected during the depressurization time are wasted, which ultimately has an impact on experiment costs. Depending on the system used and the related fluidic resistance, depressurization time can take more than tenths of seconds!
The smoother the better: Product algorithm and PID ultimately affect performance
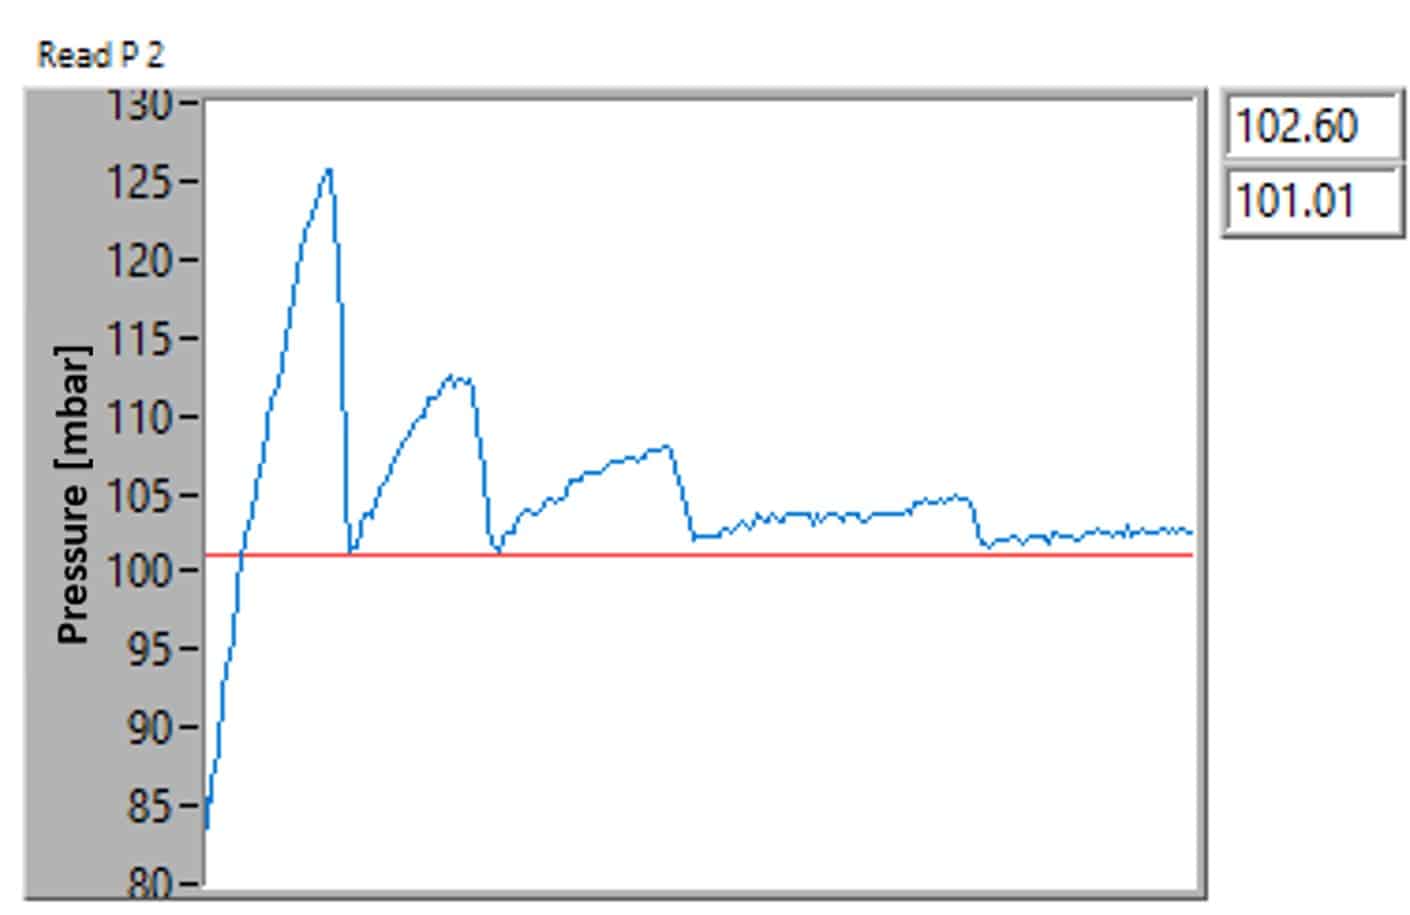
As mentioned in the above paragraphs, product specifications do not make it all. PID and algorithms also have an impact on performance. Figure 5 shows the pressure curvature during a transition from a higher pressure for the medium pressure controller. We can observe some jabbering when transitioning to 100 mbar, which is not observed using the premium pressure controller (figure 5).
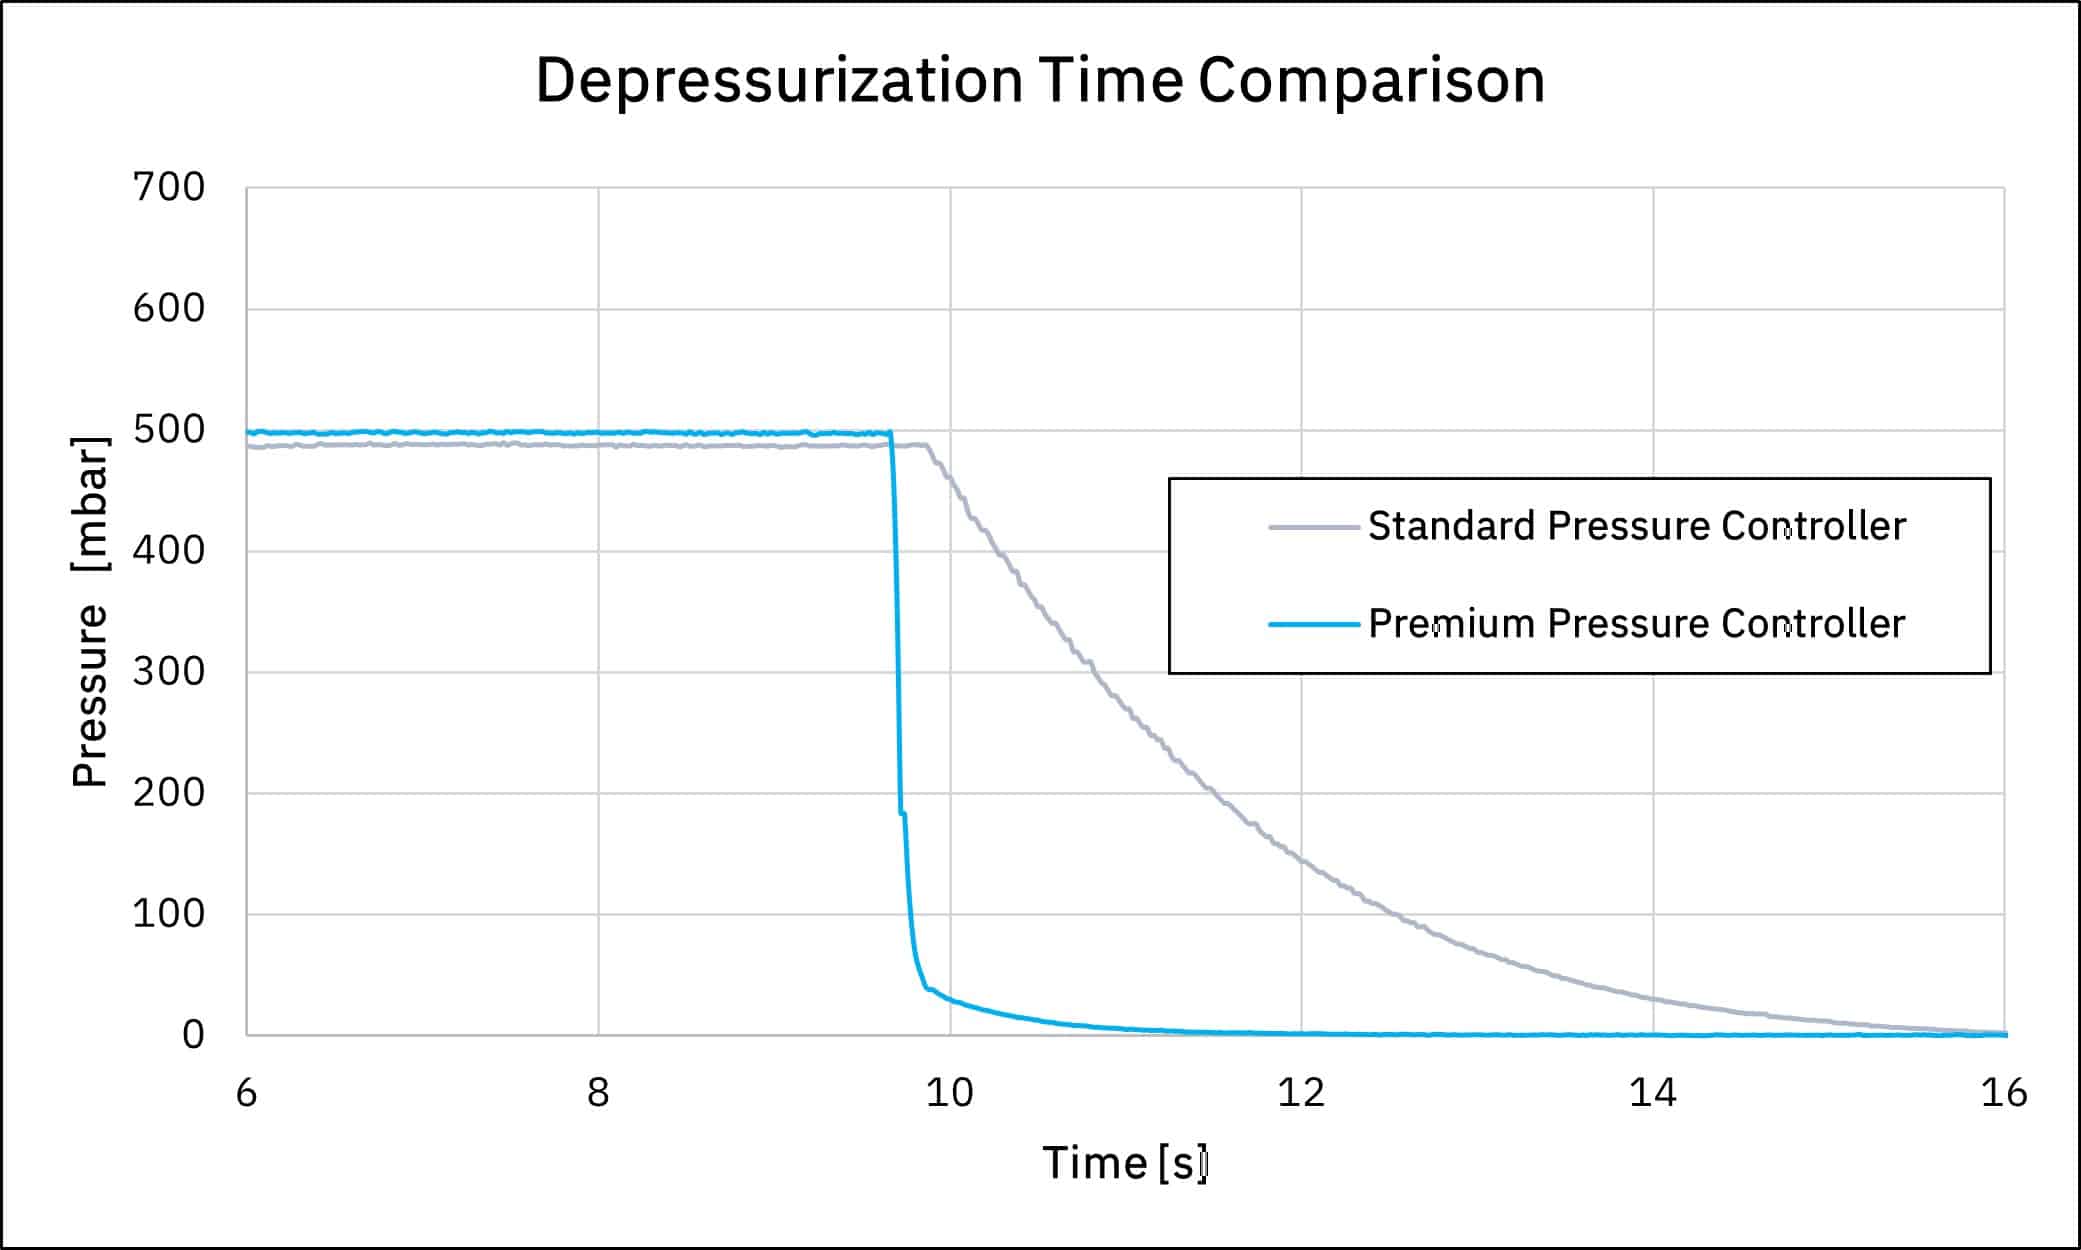
In our comparative analysis between pressure controllers, we observed noticeable differences in performance, particularly in terms of accuracy and stability. Both cost-effective pressure controllers exhibited more pronounced fluctuations and required a longer duration to achieve a state of equilibrium. Additionally, it stabilized within a less precise pressure range compared to its counterpart.
On the other hand, the premium product demonstrated a remarkably smoother and more stable transition profile. It efficiently and rapidly attained stability, aligning closely with the desired precision levels.
This superior performance in maintaining consistent pressure control under varying conditions underscores the premium product’s advanced engineering and design.
Such characteristics are particularly vital in microfluidics applications where exact pressure control is crucial for the integrity and accuracy of the results.
Microfluidics require expertise for integration
Time to market: Is your pressure controller ready to use and easy to integrate?
When using simple pressure controllers, they generally do not come with ready-to-use software and high-level functions. For the low-cost and medium-range models, an analog-to-digital communication converter was required to facilitate proper data acquisition and interpretation.
This additional step needs to be considered in terms of additional internal development and time to market. We present below a microfluidic pressure controller comparison based on ready-to-use capability:
- Cost-effective pressure controller: needs to develop an additional DAQ device for commanding the system. The absence of a need for an analog-to-digital converter indicates a more advanced and integrated design, aligning better with modern digital interfaces and standards.
- Medium range pressure controller: Although there is no need for an additional DAQ (all internal electronics integrated into the device), it is required to develop a custom software interface to start measurements.
- Premium pressure controller: Ready-to-use software with advanced dedicated SDK available in several languages (Python, C++, C#)
Mastering the microfluidic environment: pressure controllers for flow rate control, valve management, and automation
What is the difference between flow control and pressure control?
Many processes in microfluidics demand precise monitoring and regulation of flow rates, along with the integration of valves to automate complex workflows, ensuring repeatability and reliability.
Efficient flow rate monitoring facilitates precise volume injections, while valve automation proves essential for tasks such as sample preparation, multiplexing, or cleaning processes.
Explore our article for insights into the challenges of fluidic valve automation, and the advantages offered by our F-OEM flow control platform.
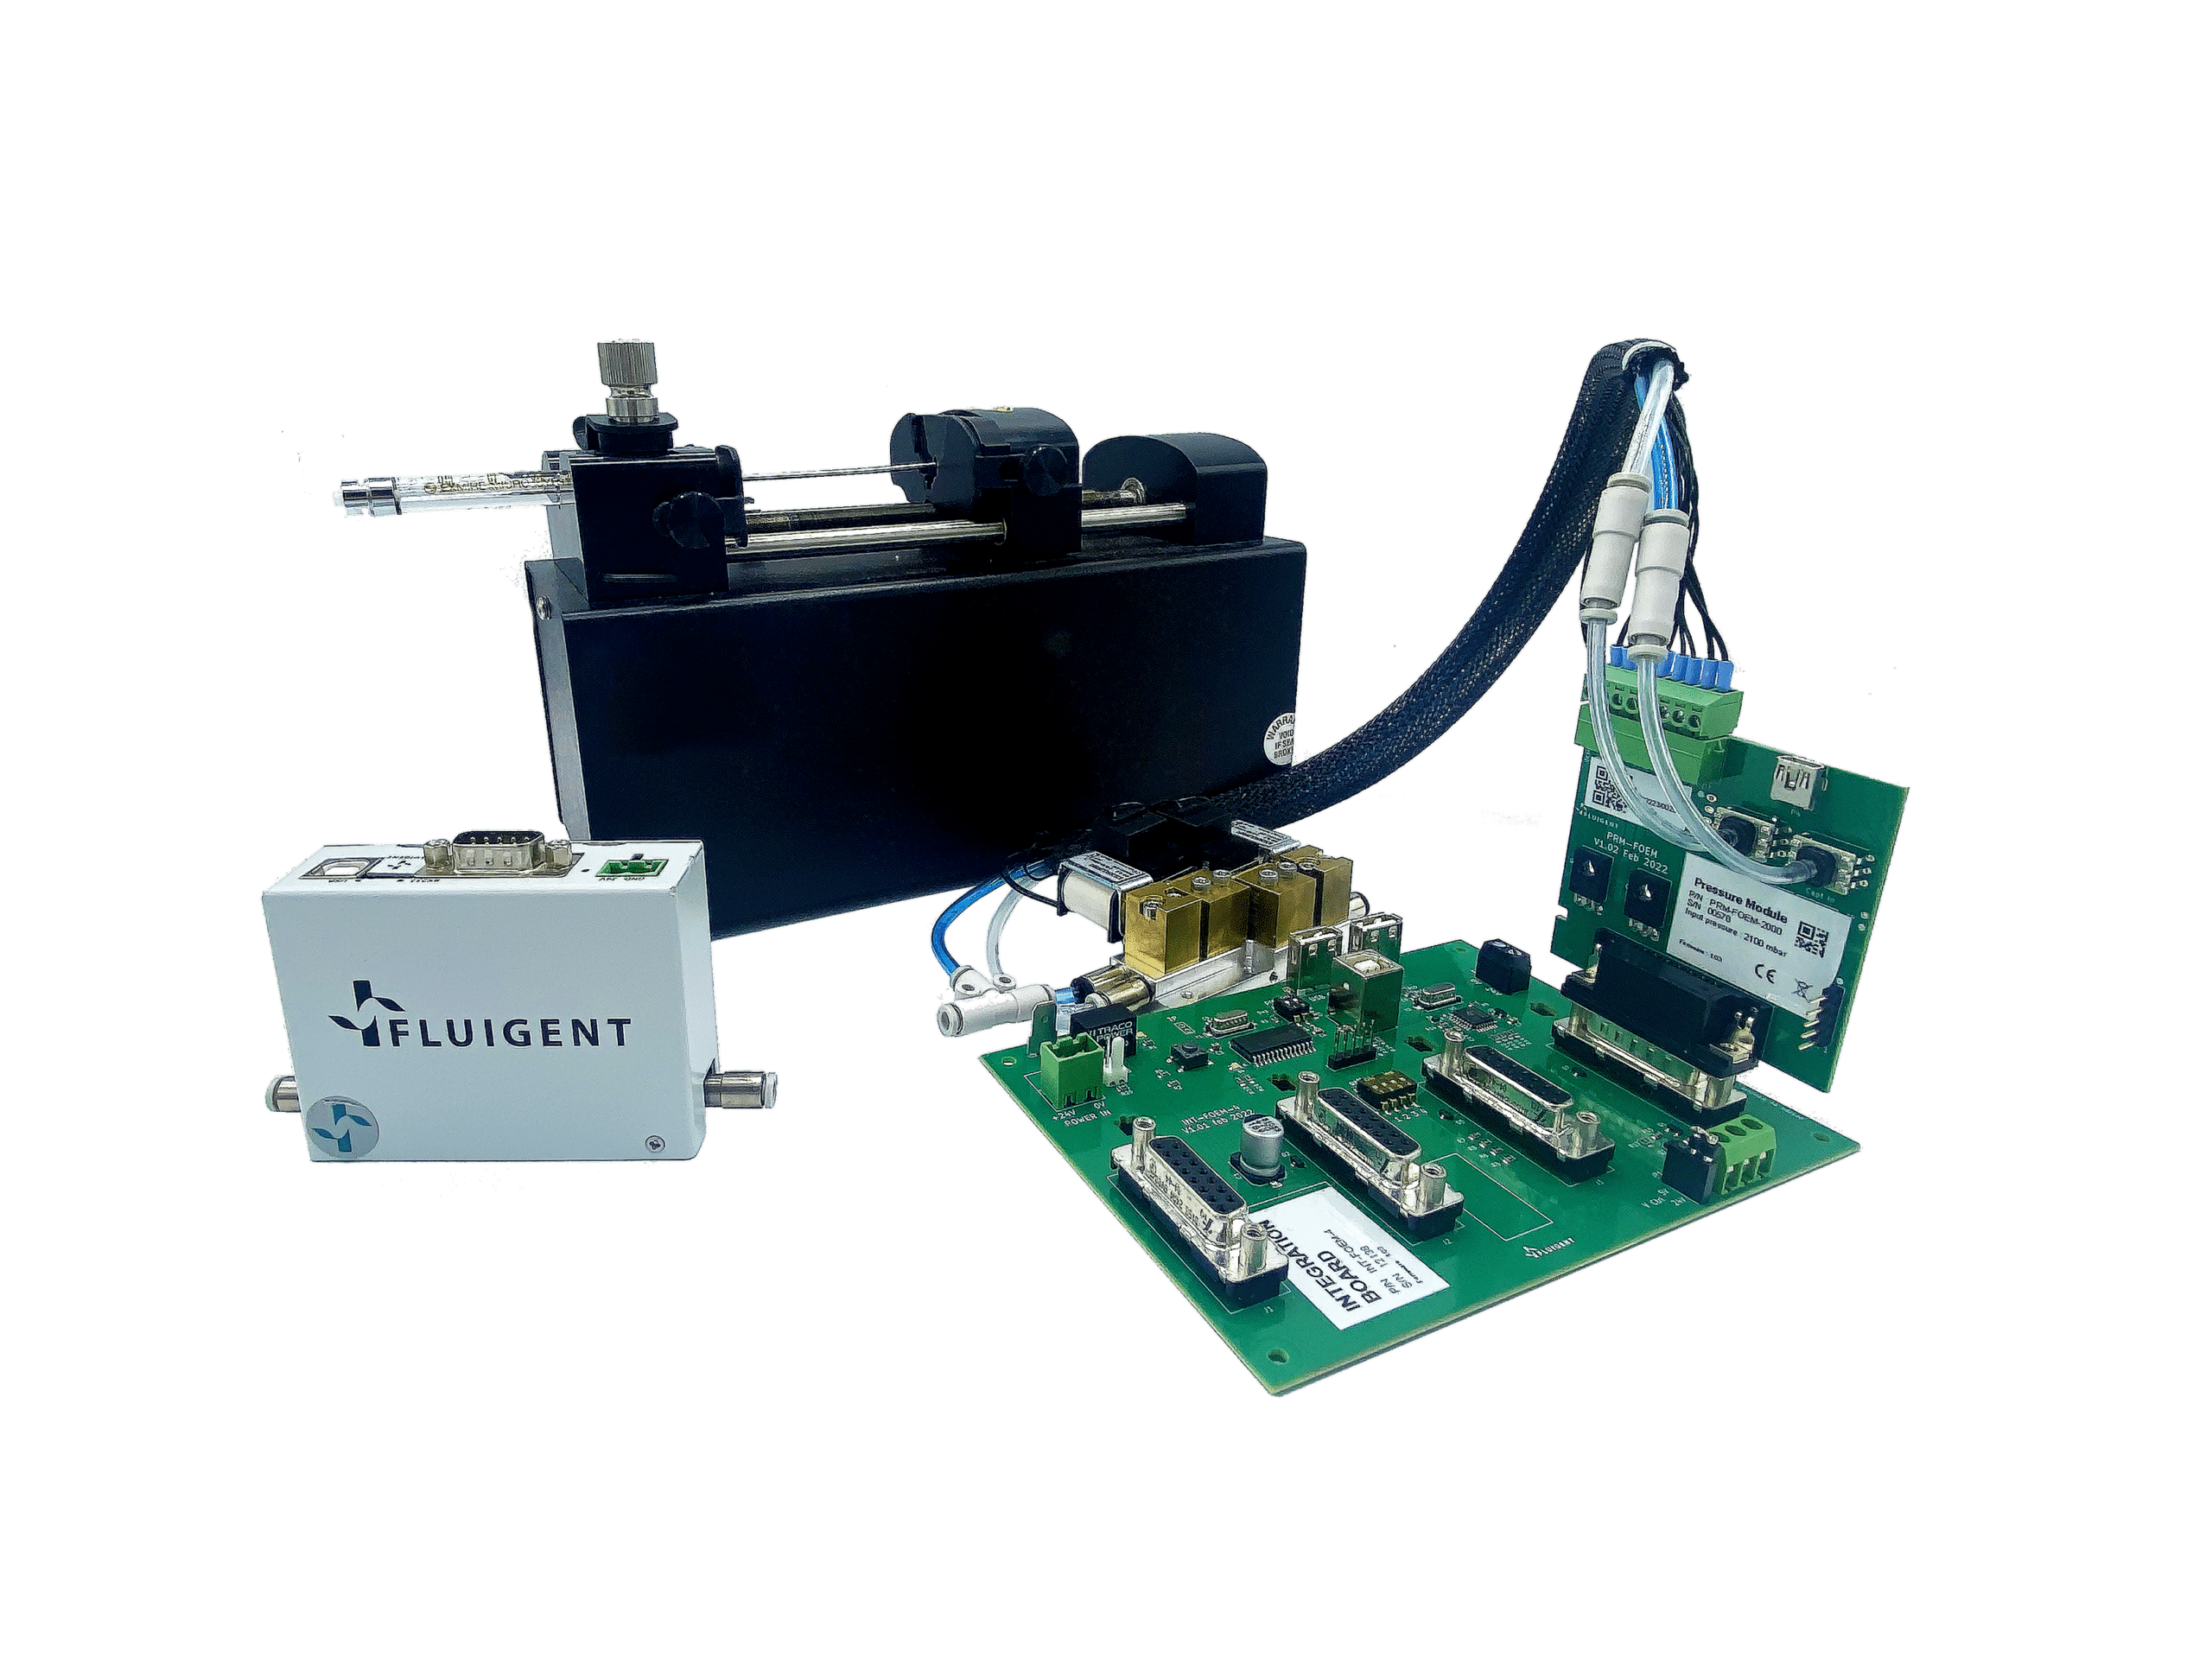
In contrast to traditional pressure controllers, achieving advanced regulation capabilities by integrating and controlling microfluidic flow sensors and valves demands expertise in electronics, mechanics, and microfluidics.
Synchronization among all microfluidic components is pivotal for seamless automation. With classical pressure controllers, integration should be done by the microfluidic expert resulting in a potentially costly, time-consuming, and resource-dependent process. This could impact time to market and compromise the final system’s reliability.
Our premium microfluidic pressure controller stands out by seamlessly interfacing with in-house microfluidic flow sensors and valves. Commanding these components requires no additional development, through dedicated software and SDK, offering a streamlined solution that enhances efficiency and reliability without sacrificing time to market.
- Cost-effective pressure controller: development needed
- Medium range pressure controller: development needed
- Premium pressure controller: Ready-to-use with Fluigent flow sensors and valves
What are the typical applications achievable with the above pressure controllers?
As seen above, each pressure controller has distinctive performance, ranging from poor/medium to excellent depending on the parameter. Microfluidic applications most generally require highly demanding fluidic performance. Consequently, all pressure controllers discussed here do not cover the complete list of microfluidic applications.
- Cost-effective pressure controller: The cost-effective pressure controller has average to poor performance in terms of accuracy, or stability. In addition, PID is not available. It makes the product limited to applications where pressure should not be highly stable, without any fast (a few seconds) pressure changes over time. It is suitable for low-precision analytical devices with flow rates higher than a hundred milliliters per minute. Typical applications include gas chromatography and semiconductor processes. In microfluidics, it can be used for injecting pressure for opening/closing valves, such as in quake valve processes.
- Medium range pressure controller: The medium pressure controller has average to great performance in terms of accuracy and stability. A basic PID is available which can be useful for less demanding microfluidic applications. It can be useful for microfluidic cell perfusion and culture, and in some cases of droplet microfluidics where production should remain stable and without frequent flow rate changes. It is however limited to complex microfluidic protocols, or where processes require minimal use of sample reagents.
- Premium pressure controller: The premium pressure controller from Fluigent was developed to meet all microfluidic application requirements. Consequently, general performance is excellent, including excellent accuracy, stability, and response time. Its patented regulation algorithm allows to finely adjust pressure during any microfluidic protocol, and flow sensor and valve integration is implemented by default, allowing complex microfluidic protocols to perform. Applications include amongst others droplet microfluidics for digital PCR and encapsulation applications, cell biology for organs on chip and cell culture, cell sorting and flow cytometry, and advanced fluorescence microscopy where all multiplexing protocols must be automated while saving previous sample reagents.
Related products
Expertise & resources
5 reasons to choose OEM pressure controllers over OEM syringe pumps for microfluidic applications
Read more- Expert Reviews: Basics of Microfluidics
Microfluidic Flow Control: Comparison between peristaltic, syringe and pressure pumps for microfluidic applications
Read more - Expert Reviews: Basics of Microfluidics
Choosing the Right Microfluidic Pressure Range
Read more 
Valve Automation with the F-OEM for Microfluidic Applications
Read more
Table of contents
I. Droplet-based microfluidics, a microfluidic chip application
Microfluidic generation of droplets has attracted a lot of interest, enabling high throughput experiments by generating millions of micro-reactors and chambers in a few seconds. This microfluidic chip application method produces highly monodispersed droplets of very small volumes (μL to fL) of fluids with high frequency (up to hundreds of kHz), providing better control of processes like mixing, encapsulation, sorting, and sensing. Microfluidic-based droplets have many diverse and varied applications, such as particle synthesis3 and chemical analysis4. Highly controlled droplet production also enables single-cell analysis or drug testing 5,6.
Microfluidic-based droplet generation and control allow for:
- Highly monodispersed (<2% size variation) droplet production, with potentially high generation rate (up to hundreds of kHz)
- Highly reproducible complex structures (water-in-oil-in-water emulsions, multiple encapsulations…)
- Single droplet manipulation as an individual pL scale biochemical reactor
- Miniaturization of production and bioanalytical devices
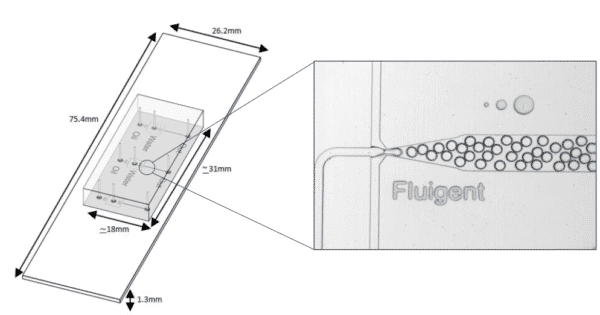
With these characteristics, droplet microfluidics has a large value, including bio(chemical) analysis, and nano and microscale generation of materials7. Several microfluidic chip designs exist to generate droplets for a various field of applications. A common design is the T-junction, where the dispersed phase is injected from a channel that is perpendicular to the channel carrying the continuous phase (figure 1).
Application of microfluidic chip using droplet microfluidic concepts, components, and processes are now being adopted and leveraged by end-users to enable new science and innovation. Real-world success is now evidenced through a range of mainstream commercial products that are applied to key biological and healthcare-related problems (e.g., 10X Genomics, Drop-seq, and nucleic acid quantification via Droplet DigitalTM PCR systems)8.
Today, it is possible to produce multiple emulsions with complex droplet morphologies. Production of multi-cored droplets (droplets that contain a controlled number of inner droplets at one or more hierarchical levels), Janus droplets (i.e. biphasic or triphasic droplets with two or three physically and chemically distinct surface domains) is now possible using droplet microfluidics9 (figure 2).
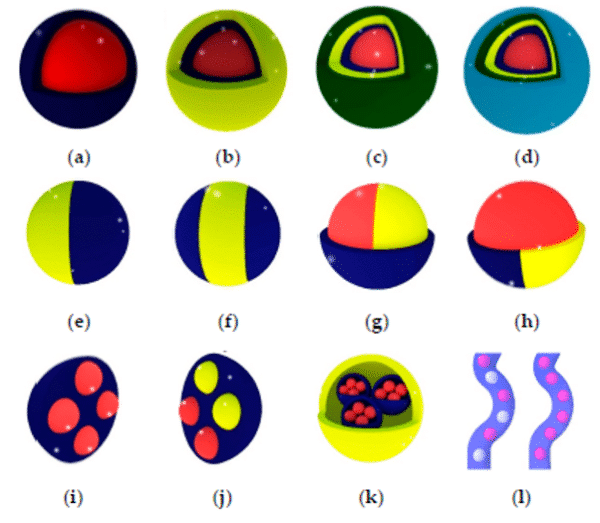
Figure 2: Types of multiple emulsions from the simple encapsulation (a), double emulsion (b), and so on (c,d) to bi- and tri-phasic structures (e to h), multiple encapsulations (I to k), and hybrid microjet achievable using droplet-based microfluidics9
Microfluidic chip application for the production of highly reproducible PLGA microparticles
In recent years, biodegradable microspheres/microparticles have gained widespread importance in the delivery of bioactive agents10. The copolymers of Poly (D, L-lactic-co-glycolic acid) (called PLGA)/poly (lactic acid) PLA microparticles are one of the most successful new drug delivery systems (DDS) in labs and clinics. Because of their biocompatibility and biodegradability, they can be used in various areas, such as long-term release systems, vaccine adjuvant, and tissue engineering11.
In PLGA microparticle production for drug release and delivery, microparticle size is a key parameter as it is directly related to the microparticles degradation rate and the drug release rate12. Although PLGA microparticle synthesis appears to be a successful drug delivery system, the current processes and tools to produce PLGA microparticles have many limitations, such as wide microparticle size distribution, poor repeatability, and aggressive chemical preparation conditions11. To solve these problems, droplet-based microfluidics application chip offers an efficient method for improvement.
Fluigent provides the Raydrop: a new breakthrough technology leading to outstanding particle size monodispersity and production flexibility. The Raydrop works as a co-flow focusing principle (figure 3). The nozzle and outlet capillary are aligned in a continuous phase chamber, the dispersed phase comes through the nozzle to create the microparticles into the continuous phase and exits by the outlet insert. Using this application of microfluidic chip method, PLGA microparticles ranging from 15 to 50 µm diameters have been successfully generated.

The PLGA microparticle production station allows excellent reproducibility and significantly improved monodispersity (CV < 2%) as compared to other methods on the market. It allows one to continuously produce PLGA microparticles (up to 10 000 droplets/s) without unwanted interruption for long-term experiments.
Apllication notes:
A microfluidic chip application for single-cell mRNA-seq sequencing using droplets: Drop-seq technology
The production of highly monodispersed emulsions or more complex structures (water-in-oil-in-water emulsions, multiple encapsulations…) makes microfluidic chip applications an excellent approach for single-cell analysis or single-cell culture. The technique allows for droplet-based single-cell RNA-sequencing, such that one can characterize complex tissues with many cell types and states under diverse conditions. One of the pioneering microfluidic chip application methods is Drop-Seq technology, which entraps a single cell and a single primer-barcoded bead in each droplet (figure 4).
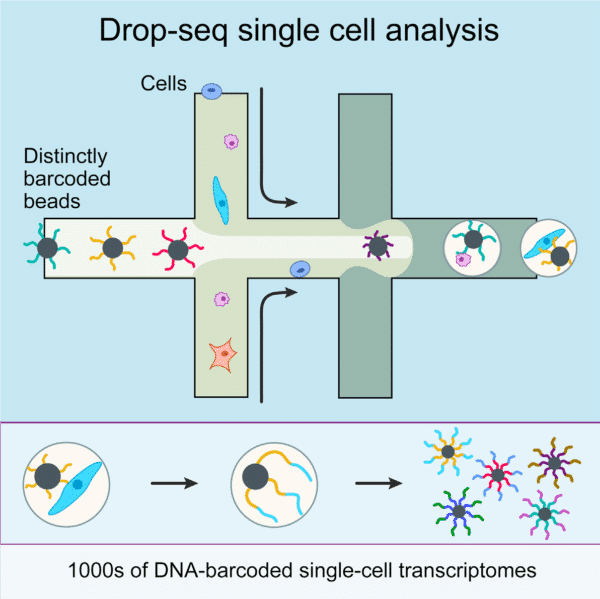
Cells are thus separated into nanoliter-sized aqueous droplets, with a different barcode associated with each cell’s mRNAs. The primers on beads contain a barcode consisting of three sequences. One sequence is for PCR amplification and is common to all the beads. The second sequence consists of hundreds of individual primers that also share the same ‘‘cell barcode’’.
Finally, the third part has different unique molecular identifiers (UMI), enabling mRNA transcripts to be digitally counted13 (figure 5). The droplets are sequenced altogether, allowing quick profiling of thousands of individual cells from a heterogeneous population.
The power of this microfluidic chip application technology resides in the fact that during sequencing, one can distinguish where the original information came on a cell to cell basis.
This allows one to make a gene expression map of the cell, or even to distinguish cell populations within a tissue.

Apllication notes:
II. Microfluidic cell culture for a better cell behavior understanding
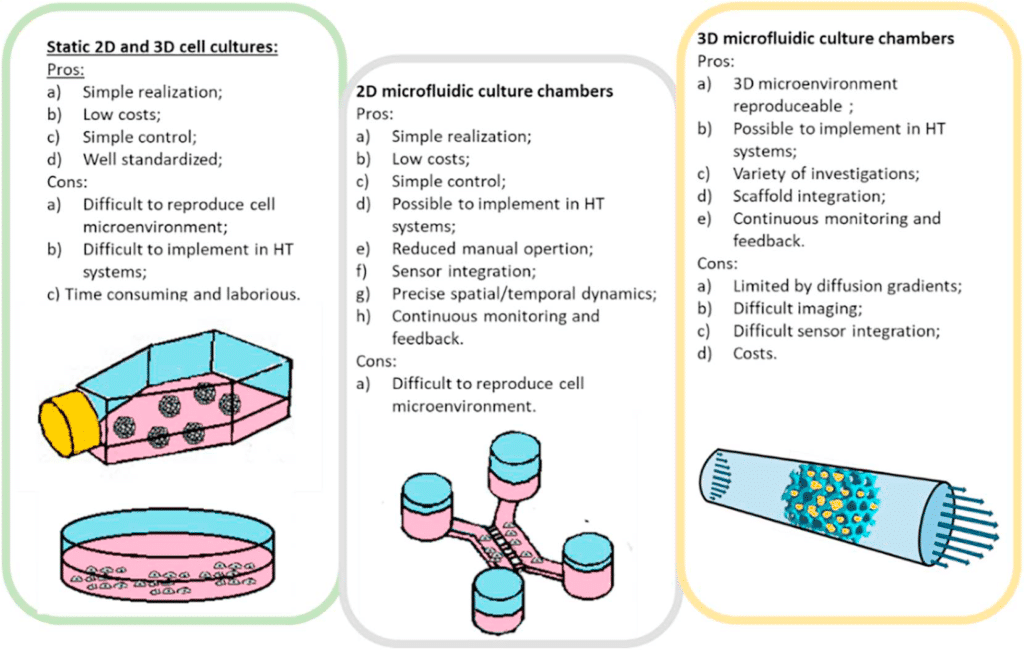
Microfluidic cell culture is another application of microfluidic chip that has significant advantages over macroscopic culture in flasks, dishes, and well-plates14 (figure 6). The microfluidic chip fabrication process allows great flexibility in the design of microfluidic devices, permitting one to understand and control interactions between cells, substrates, and the surrounding medium, physically as well as biochemically15.
This microfluidic chip application technology offers new possibilities to accurately reproduce the cellular environment and enables the analysis of biological processes that were not accessible before. Morphology-wise, chips can be structured at the cell scale to reproduce the mechanical constraints experienced by cells. Biochemically, stable gradients can be implemented with a high spatial resolution (typically, micrometer resolution).
Finally, constant perfusion enables the continuous renewal of nutrients and oxygen to promote cell growth and maintain optimal activity during long-term cell culture. Cost reduction due to volume reduction is also a major benefit15.
Microfluidic chip application model of a tumor microenvironment
The physical microenvironment of tumors is characterized by heterotypic cell interactions and physiological gradients of nutrients, waste products, and oxygen. This tumor microenvironment has a major impact on the biology of cancer cells and their response to chemotherapeutic agents. Despite this, most in vitro cancer research still relies primarily on cells grown in 2D and in isolation in nutrient and oxygen-rich conditions.
Ayuso et al. presented an easy-to-use microfluidic chip application device that can mimic the three-dimensional architecture of multicellular spheroids, while at the same time generating a visible, live “tumor slice” that allows easy monitoring of cells in different regions of the microenvironment in real-time as well as their response to different drugs17 (figure 7).
In this application of microfluidic chip setup, tumor cell behavior in different regions of the microdevice was studied and analyzed in conjugation with measurements of hypoxia and glucose concentrations across the device. The differential cellular response to several well-known drugs in different parts of the microdevice emphasizes the potential of this technology for analyzing the impact of microenvironmental parameters on drug response.
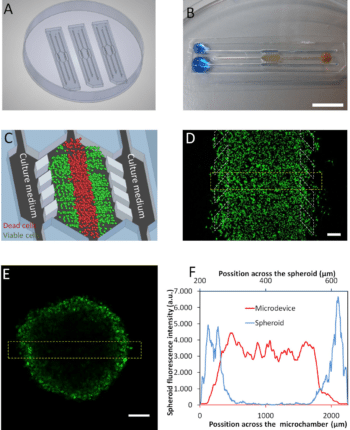
The figure presents microdevices in a Petri dish containing a central culture chamber and 6 channels. To better understand how the chip works, picture B shows one microdevice filled with (yellowish) collagen hydrogel flowing to the microchamber from the right middle channel and blue-colored water perfused through the two lateral microchannels.
In experimental conditions, the culture medium perfused through the lateral microchannels provides nutrients and oxygen creating physiological gradients across the device. Cells near the ‘surrogate’ blood vessels are viable, whereas oxygen-poor cells in the center of device start to die creating a ‘necrotic core’ similar to the necrotic regions of tumors. It is possible to monitor cells with fluorescent dye in microdevice17 (picture D).
Application notes & expertises:
- Assess Cell Proliferation Using Pressure as a Tool
- Creating a Microfluidic Cancer-on-Chip Platform
- Cancer Cell Analysis Made Easy with Aria: cell Capture and Labeling
- Passive and active mechanical stimulation in microfluidic systems
- Mimicking in-vivo environments: biochemical and biomechanical stimulation
III. Organ on a chip, a cutting edge application of microfluidic chip
Many efforts are devoted to the development of cancer metastasis models that can help in understanding the disease and the development of innovative therapeutic strategies. Current in vitro and in vivo cancer models are incapable of satisfactorily predicting the outcome of various clinical treatments on patients18. Therefore, new application of microfluidic chip methods and approaches for drug discovery and health research are being developed. The concept of mimicking the organ-level function of human physiology or disease using cells inside a microfluidic chip application setup was first published in 2004. In 2010 that the term organ-on-a-chip (OOAC) was invented by Ingber, et. al., who developed a microfluidic chip model to capture organ-level functions of the human lung19.
Microfluidic chip applications enable one the unique ability to control the cellular microenvironment with high spatiotemporal precision and to present cells with mechanical and biochemical signals in a more physiologically relevant context19. The manipulation of the micro-liter volumes of liquids has made these models a platform where scaling, and dynamic crosstalk between cells can be achieved. Microfluidic chips can now use geometries and structures to permit the use of physiological length scales, concentration gradients, and the mechanical forces generated by fluid flow to mimic the in vivo microenvironment experienced by cells20.
These biomimetic applications platforms overcome many drawbacks encountered with conventional tissue culture models. OOAC engineering microfluidic chip application has attracted enormous interest and attention from the pharmaceutical industry, regulatory agencies, and even national defense agencies. This is demonstrated by the increase of OOAC research papers and by the emergence of at least 28 organ-on-a-chip companies in less than seven years21.
A microfluidic chip design to reconstitute organ-level lung functions
To demonstrate that it is possible to engineer a microsystem that replicates the complex physiological functionality of living organs, Huh et al. developed a multifunctional microdevice that reproduces key structural, functional, and mechanical properties of the human alveolar-capillary interface, which is the fundamental functional unit of the living lung19. The microfluidic chip application device consisted of compartmentalized PDMS microchannels to form an alveolar-capillary barrier on a thin, porous, flexible PDMS membrane coated with the extracellular matrix and human alveolar epithelial cells and human pulmonary microvascular endothelial cells is cultured on opposite sides of the membrane (figure 8).
In fact, the device recreates physiological breathing movements (shown in Figure 8.B) by applying vacuum to the side chambers and causing mechanical stretching of the PDMS membrane forming the alveolar-capillary barrier. The device is made of 3 PDMS layers that are bonded to form two sets of three parallel microchannels. (Figure 8.C) PDMS etchant is flowed through the side channels in order to form the two large side chambers. (Figure 8.D). Figure 8.E represents an image of an actual lung-on-a-chip microfluidic device19.
To put it in a nutshell, air is subsequently introduced into the compartment to create an air-liquid interface to mimic the lining of the alveolar air space19 .
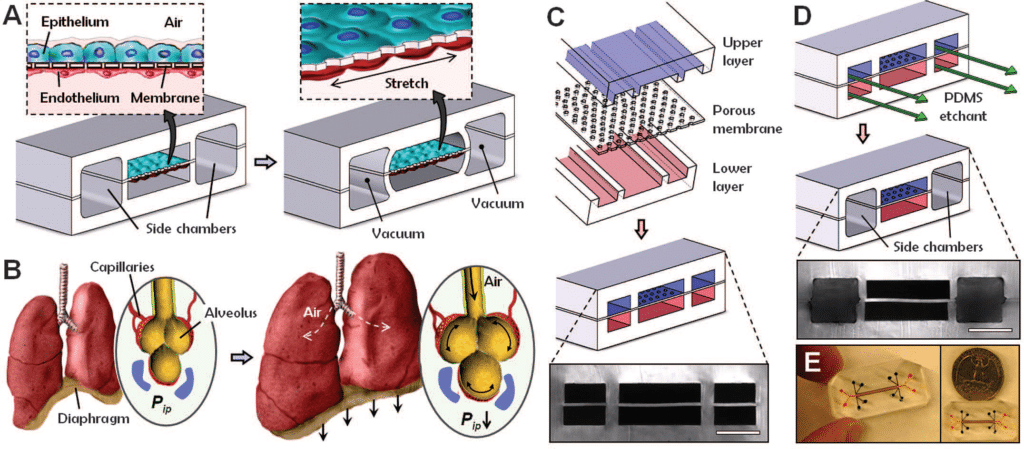
Using this microfluidic chip application platform, the authors demonstrated that breathing motions, simulated by the organ-on-chip platform, might greatly accentuate the proinflammatory activities of silica nanoparticles and contribute substantially to the development of acute lung inflammation19. This behavior could not be determined using existing in vitro models.
Application notes & expertises:
- Peristaltic Pump vs Pressure-Based Microfluidic Flow Control for Organ on Chip applications
- Long-term fluid recirculation system for Organ-on-a-Chip applications
- CNRS/UTC: study of a liver-on-a-chip model
- Development of a human gut-on-chip to assess the effect of shear stress on intestinal functions
- Cartilage-on-a-chip, an example of complex mechanical stimulation using Fluigent’s technology
- Creating a Microfluidic Cancer-on-Chip Platform using Fluigent’s High Throughput Cell Perfusion Pack
IV. Particle and cell sorting applications using cell sorter chips
Efficiently isolating and organizing cells from complex mixtures is a crucial task in various fields such as biology, biotechnology, and medicine. Microfluidic chips play a pivotal role in this process, commonly employed to enrich or purify cell samples, thereby enhancing efficiency in research and development22.
Traditionally, optical methods like FACS (Fluorescent Activated Cell Sorting) are used for cell detection. FACS utilizes a laser beam, with the scattered light providing characteristic information about cells and their components. Automated and robust, FACS platform has been a gold standard for cell sorting. However, current commercial platforms face limitations in sample throughput and processing speeds, posing challenges for generating clinical-scale samples.
In contrast, platforms with microfluidic chip offer affordability, simplicity, and a smaller footprint. These chips employ various techniques for cell sorting, each with specific speeds and efficiencies. The chip’s dimensions accommodate diverse cell sorters, ranging from large-volume to precise single-cell sorters.
Additionally, microfluidic cell sorting can integrate various fluidic operations within a single chip, making it versatile for lab-on-a-chip applications, diagnostics, and therapeutics. This approach holds promise in both academic and industrial labs.
Cell sorter in microfluidic devices relies on determining specific cell parameters, such as size, shape, density, or surface markers. Heterogeneous cell solutions are injected into the microfluidic chip, where cells with different properties experience varying forces, leading to their separation into different streamlines and exits.
Microfluidic cell sorting can be categorized into three categories:
- Fluorescent label-based,
- Bead-based
- Label-free cell sorting22
Label-free sorting is perhaps the most studied and comprises both active systems (relying on external fields for sorting) and passive systems that don’t use fluorescent labels or beads. Instead, these methods leverage inherent differences in cellular morphology between cell groups 22.
Inertial microfluidics for continuous particle separation in spiral microchannels
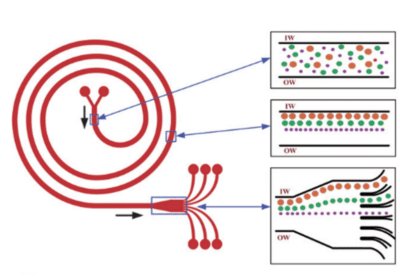
Kuntaegowdanahalli et al. developed a simple inertial microfluidic device for continuous multi-particle separation, using the Dean-coupled inertial migration principle in spiral microchannels.
In this innovative design, dominant inertial forces, combined with the Dean rotational force arising from the microchannel’s curved geometry, cause particles to settle at a single equilibrium position near the inner microchannel wall. The specific position of particle equilibrium is determined by the ratio of inertial lift to Dean drag forces.
The researchers applied this principle to create a spiral lab-on-a-chip, showcasing size-dependent particle focusing at distinct equilibrium positions across the microchannel cross-section from a multi-particle mixture23. Randomly dispersed particles equilibrate at different positions along the inner wall of the spiral microchannel, influenced by lift and drag forces (see Figure 9 – insert 2). As the particles reach the end of the spiral, they align and separate into different channels (see Figure 9 – insert 3).
A notable advantage of this microfluidic chip application is its high throughput, reaching 1.5 mL/min, achieved without the need for sheath flow or sequential cell manipulation. This feature is particularly beneficial for processing native biological fluids and applications in flow cytometry.
Application notes & expertises:
V. Micromixers an application using microfluidic chips
Micromixers play a crucial role in lab-on-chip devices for various microfluidic chip applications, including drug delivery, sequencing, amplification, and biochemical reactions. They can be broadly classified into two categories based on the actuation method: passive and active.
Passive mixing relies on the microfluidic chip’s geometry and fluid properties without external sources. In laminar flow, typical in microfluidics, mixing primarily occurs through diffusion. This property allows for precise tuning of mixing by employing lamination, where two or more liquids flow in parallel, enabling diffusion to take place. For emproved and faster mixing, chaotic advection can be induced by modifying the microfluidic chip’s geometry, altering channel shapes for splitting, folding, stretching, or disrupting fluid flow.
On the other hand, active mixing involves external perturbation. Various methods are employed in the microfluidic chip application field for active mixing. Dielectrophoresis mixing uses an electric field to move particles toward or away from an electrode, creating chaotic advection. Acoustic wave energy can also mix fluids by generating strong acoustic waves that interfere with each other, creating advection 24. Additionally, adjusting the microfluidic chamber temperature can enhance mixing, as the diffusion coefficient of a liquid is temperature-dependent25.
Submillisecond organic synthesis using a serpentine-shaped microfluidic chip application

In chemical synthesis, it is important to explore the synthetic pathways of an intermediate. To fully observe these pathways, control over its lifetime and mixing time is required.
The reaction mixture had to be well-mixed within the lifetime of the reactive intermediate. An efficient means of prolonging the lifetime is to lower the reaction temperature (-78°C to -100 °C), above the melting point of many organic solvents. Using microfluidic devices, mixing can be extremely fast, with mixing times unattainable by batches26. However, mixing time is increased at low temperatures, as the solvent viscosity exponentially increases.
To circumvent this issue, the authors used a three-dimensional serpentine-shaped microfluidic chip, allowing improved mixing by chaotic advection. The conceptual scheme of the 3D serpentine microchannel fabricated by lamination is represented in figure 10.A.
The figure 10.B represents a detailed scheme for a nanoliter reaction space of rectangular 3D serpentine channels with three inlets and the optical image showing from the top the nanoliter reaction space schematized in B. The optical images of respectively the chip reactor module and assembly are illustrated in Figure 10.D and E.
The utilization of this platform for the application enabled submillisecond mixing.
VI. Microvalves and microfluidic chip applications with reduced internal volume
In the past 10 years, efforts have been devoted to the development of microfluidic platforms capable of performing several assays using programmable fluidic operations within an array of microvalves. Similar to programmable logic circuits where multiple electronic computing routines are executed on a single microdevice, programmable microfluidic platforms have been implemented27, allowing one to perform fluidic operations such as mixing, sampling, washing, and reacting automatically within a single microfluidic chip by modifying the sequence/order of fluidic operations using the software.
The primary advantage of microvalves over their macroscale counterparts is the significantly reduced dead volume, which is important in many microfluidic chip applications that require precise flow control at small flow rates28. They are useful in biological and chemical applications, such as quantitative metabolic biomarker and genetic analysis29,30, protein-based biomarker detection31, or small molecule chemical and environmental analysis32. These microfluidic chip and valve application platforms usually consist of a 2D array of microvalves that permit flow regulation, on/off switching and sealing of liquids, gases, or vacuums33.
Several microvalves have been developed using pneumatic, electrokinetic and electrochemical actuators. Among these mechanisms, pneumatic actuation is often recognized as the most reliable method due to the simplicity of fabrication, ease of use, scalability, reliability, and a high degree of accuracy. Pneumatically actuated microvalves utilize the deflection of an elastomer (typically PDMS) membrane to control fluid flow34.
A fully integrated multilayer microfluidic chemical analyze for automated sample processing, labelling, and analysis
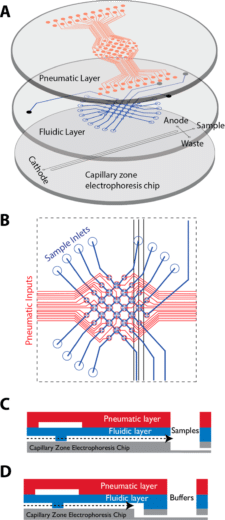
Capillary zone electrophoresis (CZE), is a powerful tool for chemical analysis and is widely used for environmental monitoring, astrobiology, and biosensing32. CZE assays usually require complex and manual sample processing.
Commercial platforms for automated CZE have been implemented to address this concern, but are expensive, and large, thus hardly field deployable in challenging environments. Microfluidic application chips and devices allow miniaturization, automation, and reduction in sample volume requirements for chemical and biochemical sensing.
Using membrane microvalve technology, it is possible to automate metering, transporting, routing, and mixing operations. Kim et al. introduced a microfluidic platform consisting of pneumatically actuated “lifting gate” microvalves integrated with a glass CZE microchip, providing extremely low dead volumes between components.
All the procedures, including buffer filling, labeling, and dilution, can be automated. The microchip was used to analyze diverse compound classes, such as amino acids, and oxidized biomarker compounds, like aldehydes/ketones and carboxylic acids in less than 30 min.
VII. Wearable microfluidics: an emerging application
An emerging application of microfluidic chip, is the use of microfluidic concepts for wearable device applications36. Here, microfluidics presents several key value propositions. The microstructures store or handle fluids and are the core of the sensing device. Using microchannels of the microfluidic chip, precise liquid amounts can be manipulated, allowing for highly accurate and reliable devices and being useful for bodily fluids that are often secreted or extracted in limited quantities.
Also, wearable microfluidic devices could also stock a specific drug for precise dispensing at controlled intervals. Innovations in flexible microfluidics and electronics have led to numerous applications. Typically, a wearable microfluidic device will collect a fluid, transfer it to a localized site where detection or measurement is performed. Blood and sweat are common analytes as they provide insights into physiological states such as temperature, pH, and hydration36. Wearable microfluidics finds applications in the pharmaceutical, food, sportswear, and cosmetic fields.
A wearable microfluidic device for the capture, storage and colorimetric sensing of sweat
A wearable microfluidic device for the capture, storage and colorimetric sensing of sweat
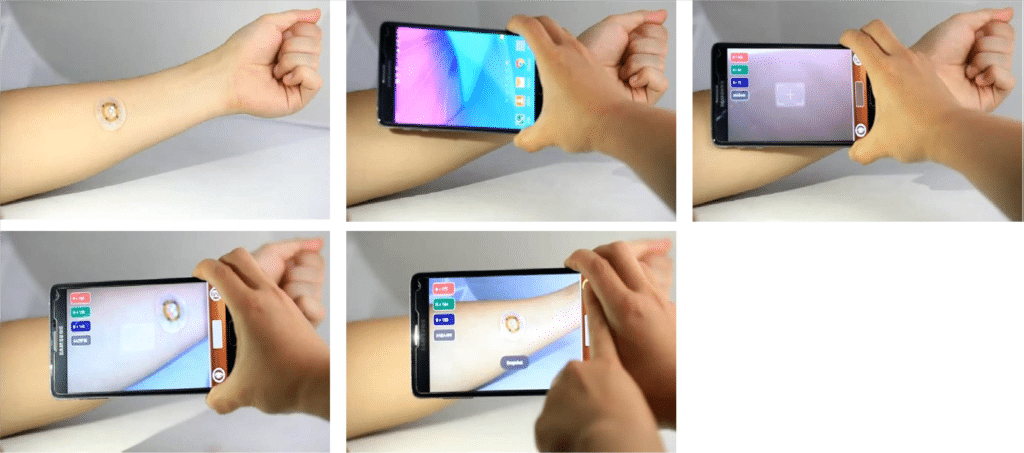
As mentioned previously, sweat is an analyte of interest because of its rich content of important biomarkers. It is easy to collect compared to blood. In situ quantitative analysis of sweat is of great interest for monitoring physiologic health status (for example, hydration state) and for the diagnosis of disease37.
Existing systems for sweat collection and analysis are confined to laboratories, where standard analytical technologies can be performed. Though highly precise, the analysis is time-consuming and costly.
To address this issue, Kho et al. developed a soft wearable microfluidic system than can directly harvest sweat from pores on the surface of the skin37.
The device routes the sample to different channels and reservoirs for multiparametric sensing of markers of interest, with options for wireless interfaces to external devices for image capture and analysis.
The device can measure total sweat loss, pH, lactate, chloride, and glucose concentrations by colorimetric detection using wireless data transmission. As it is a simple, low-cost, and fast analysis point of care device, it could be used to accumulate data from individual users over time, and this could serve as an analytical approach for interpreting trends in marker concentrations, potentially providing warning signs when performing physical activity.
Conclusion
Since the introduction of microfluidics, the scope of microfluidic chip applications has kept extending over the years. The first applications were focused on analytical chemistry, but today the field of life science and specifically point of care is in the core of microfluidics. We have presented applications where microfluidic chips show great advantages compared to conventional systems. The importance of these applications was illustrated by showing research papers related to these applications. Some important applications of microfluidic chip were introduced here. Microfluidics covers a wide range of applications such as microreactors, bioprinting, fuel cells, and many more.
Expertises
-
Microfluidics case studies Creating a Microfluidic Cancer-on-Chip Platform using Fluigent’s High Throughput Cell Perfusion Pack Read more
-
Microfluidic Application Notes Long-term fluid recirculation system for Organ-on-a-Chip applications Read more
-
Microfluidics case studies CNRS/UTC: study of a liver-on-a-chip model Read more
-
Microfluidic Application Notes Alginate Microcapsule Synthesis Read more
-
Microfluidic Application Notes Agarose Microcapsules Synthesis Read more
-
Microfluidic Application Notes PLGA nanoparticle synthesis using 3D microfluidic hydrodynamic focusing Read more
-
Microfluidic Application Notes Development of a human gut-on-chip to assess the effect of shear stress on intestinal functions Read more
-
Microfluidic Application Notes PLGA microcapsules synthesis Read more
-
Microfluidic Application Notes Peristaltic Pump vs Pressure-Based Microfluidic Flow Control for Organ on Chip applications Read more
-
Microfluidic Application Notes Double Emulsion Generation Read more
-
Microfluidic Application Notes Microfluidic Chitosan Microcapsules Production Read more
-
Microfluidic Application Notes Alginate Microbeads Production Read more
-
Microfluidic Application Notes Single cell sorter microfluidic platform Read more
-
Microfluidic Application Notes Assess Cell Proliferation Using Pressure as a Tool Read more
-
Microfluidic Application Notes Cartilage-on-a-chip, an example of complex mechanical stimulation using Fluigent’s technology Read more
-
Expert Reviews: Basics of Microfluidics Mimicking in-vivo environments: biochemical and biomechanical stimulation Read more
References
- Seemann, R., Brinkmann, M., Pfohl, T. & Herminghaus, S. Droplet based microfluidics. Reports Prog. Phys. 75, (2012).
- Paquin, F., Rivnay, J., Salleo, A., Stingelin, N. & Silva, C. Droplet Control Technologies for Microfluidic High Throughput Screening (µHTS). Muhsincan Sesen,a Tuncay Alan,a and Adrian Neild∗a 10715–10722 (2017) doi:10.1039/b000000x.
- Galas, J. C., Bartolo, D. & Studer, V. Active connectors for microfluidic drops on demand. New J. Phys. 11, (2009).
- Jullien, M.-C., Tsang Mui Ching, M.-J., Cohen, C., Menetrier, L. & Tabeling, P. Droplet break in a low capillary T-junction. in 19th Mechanical French Congress (AFM, Maison de la Mécanique, 39/41 rue Louis Blanc-92400 Courbevoie, 2009).
- Yu, L., Chen, M. C. W. & Cheung, K. C. 2010 Droplet-based microfluidic system for multicellular tumor spheroid formation and anticancer drug testing. Lab Chip 10, 2424–2432 (2010).
- N.Shembekar, C.Chaipan, R. U. & C. A. M. 2016 Droplet-based microfluidics in drug discovery, transcriptomics and high-throughput molecular genetics. Lab Chip (2016) doi:10.1039/C6LC00249H.
- Shang, L., Cheng, Y. & Zhao, Y. Emerging Droplet Microfluidics. Chem. Rev. 117, 7964–8040 (2017).
- Suea-Ngam, A., Howes, P. D., Srisa-Art, M. & Demello, A. J. Droplet microfluidics: From proof-of-concept to real-world utility? Chem. Commun. 55, 9895–9903 (2019).
- Vladisavljević, G. T., Al Nuumani, R. & Nabavi, S. A. Microfluidic production of multiple emulsions. Micromachines 8, (2017).
- Soppimath, K. S. & Aminabhavi, T. M. Ethyl acetate as a dispersing solvent in the production of poly(DL-lactide-co-glycolide) microspheres: Effect of process parameters and polymer type. J. Microencapsul. 19, 281–292 (2002).
- Qi, F., Wu, J., Li, H. & Ma, G. Recent research and development of PLGA / PLA microspheres / nanoparticles : A review in scienti fi c and industrial aspects. (2018).
- Anderson, J. M. & Shive, M. S. Biodegradation and biocompatibility of PLA and PLGA microspheres. Adv. Drug Deliv. Rev. 64, 72–82 (2012).
- Macosko, E. Z. et al. Highly parallel genome-wide expression profiling of individual cells using nanoliter droplets. Cell 161, 1202–1214 (2015).
- Halldorsson, S., Lucumi, E., Gómez-Sjöberg, R. & Fleming, R. M. T. Advantages and challenges of microfluidic cell culture in polydimethylsiloxane devices. Biosens. Bioelectron. 63, 218–231 (2015).
- Yeo, L. Y., Chang, H. C., Chan, P. P. Y. & Friend, J. R. Microfluidic devices for bioapplications. Small 7, 12–48 (2011).
- Coluccio, M. L. et al. Microfluidic platforms for cell cultures and investigations. Microelectron. Eng. 208, 14–28 (2019).
- Ayuso, J. M. et al. Development and characterization of a microfluidic model of the tumour microenvironment. Sci. Rep. 6, 1–16 (2016).
- Caballero, D. et al. Organ-on-chip models of cancer metastasis for future personalized medicine: From chip to the patient. Biomaterials 149, 98–115 (2017).
- Huh, D. et al. Reconstituting organ-level lung functions on a chip. Science (80-. ). 328, 1662–1668 (2010).
- Bhise, N. S. et al. Organ-on-a-chip platforms for studying drug delivery systems. J. Control. Release 190, 82–93 (2014).
- Zhang, B., Korolj, A., Lai, B. F. L. & Radisic, M. Advances in organ-on-a-chip engineering. Nat. Rev. Mater. 3, 257–278 (2018).
- C. Wyatt Shields IV, Dr. Catherine D. Reyes, and P. G. P. L. Microfluidic Cell Sorting: A Review of the Advances in the Separation of Cells from Debulking to Rare Cell Isolation. Lab Chip (2015) doi:10.1039/c4lc01246a.
- Kuntaegowdanahalli, S. S., Bhagat, A. A. S., Kumar, G. & Papautsky, I. Inertial microfluidics for continuous particle separation in spiral microchannels. Lab Chip 9, 2973–2980 (2009).
- Vivek, V., Zeng, Y. & Kim, E. S. NOVEL ACOUSTIC-WAVE MICROMIXER.
- Ward, K. & Fan, Z. H. Mixing in microfluidic devices and enhancement methods. J. Micromechanics Microengineering 25, (2015).
- Kim, H. et al. Submillisecond organic synthesis: Outpacing Fries rearrangement through microfluidic rapid mixing. Science (80-. ). 352, 691–694 (2016).
- Thorsen, T., Maerkl, S. J. & Quake, S. R. Microfluidic large-scale integration. Science (80-. ). 298, 580–584 (2002).
- Aditya Aryasomayajula, Pouriya Bayat, Pouya Rezai, P. R. S. Microfluidic Devices and Their Applications. Springer vol. 50 (2017).
- Jensen, E. C., Bhat, B. P. & Mathies, R. A. A digital microfluidic platform for the automation of quantitative biomolecular assays. Lab Chip 10, 685–691 (2010).
- Vincent, M., Xu, Y. & Kong, H. Helicase-dependent isothermal DNA amplification. EMBO Rep. 5, 795–800 (2004).
- Erik C. Jensen, Yong Zeng, Jungkyu Kim, and R. A. M. Microvalve Enabled Digital Microfluidic Systems for High Performance Biochemical and Genetic Analysis. 15, 455–463 (2011).
- Kim, J., Jensen, E. C., Stockton, A. M. & Mathies, R. A. Universal microfluidic automaton for autonomous sample processing: Application to the mars organic analyzer. Anal. Chem. 85, 7682–7688 (2013).
- Oh, K. W. & Ahn, C. H. A review of microvalves. J. Micromechanics Microengineering 16, (2006).
- Kim, J., Stockton, A. M., Jensen, E. C. & Mathies, R. A. Pneumatically actuated microvalve circuits for programmable automation of chemical and biochemical analysis. Lab Chip 16, 812–819 (2016).
- Chin, V. I. et al. Microfabricated platform for studying stem cell fates. Biotechnol. Bioeng. 88, 399–415 (2004).
- Yeo, J. C., Kenry & Lim, C. T. Emergence of microfluidic wearable technologies. Lab Chip 16, 4082–4090 (2016).
- Ahyeon Koh, Daeshik Kang, Yeguang Xue, Seungmin Lee, Rafal M. Pielak, Jeonghyun Kim, Taehwan Hwang, Seunghwan Min,1 Anthony Banks, Philippe Bastien, Megan C. Manco, Liang Wang, Kaitlyn R. Ammann, Kyung-In Jang, Phillip Won Seungyong Han, Roozbeh Ghaffari, J. A. R. A soft, wearable microfluidic device for the capture, storage, and colorimetric sensing of sweat. Sci. Transl. Med. 26, 39–46 (2017).
Technological advances for vaccine development
First-generation vaccines are based on whole organisms, in either live attenuated or killed forms. Second-generation vaccines consist of protein components derived from the organism. Today, third-generation vaccines are being developed. These nucleic acid vaccines are based on the genetic material of the infectious organism. DNA vaccines are examples of third generation vaccines. Clinical trials for DNA vaccines to prevent HIV are currently underway.
During the COVID-19 pandemic, the first vaccines to reach clinical trials were based on viral vector and nucleic acid technologies. One of the most promising vaccine candidates was based on mRNA, as it offers a cost-effective, easy to manufacture, adaptable solution and induces both a cellular and a humoral response.
Scientific advances are becoming more and more critical in the success of fundamental vaccine research, vaccine development, and diagnostics. New methods such as microfluidics for vaccine research can be used to improve development processes.
Microfluidics in vaccine research and development
Efficient delivery of mRNA and DNA into target cells in vivo is a major challenge. Today, many vaccines are encapsulated into nanoparticles, specifically lipid nanoparticles (LNP) such as liposomes, for improved delivery efficiency. The first COVID-19 vaccines to reach the market are mRNA vaccines encapsulated in LNP.
Size and size distribution are essential properties in determining the clinical success of nanocarriers. Recently, improvements have been made in the development of microfluidic production methods, in which LNP formation occurs within a confined microenvironment with spontaneous self-assembly of the phospholipids as a sphere to minimize surface energy. These methods have demonstrated higher control over the physical properties of the end product, particularly in terms of liposome size and size distribution.
Examples of microfluidics applications in vaccine development
Vaccine adjuvant production
Among the various applications of microfluidics in vaccine development, adjuvant production is on the front line. Adjuvants are used to amplify the recipient’s specific immune responses against pathogen infection. A new generation of adjuvants is being developed to meet the demands of improved antigen-specific responses with less toxicity. For example, Konishi et al. reported the first synthesis of a series of saponins, a vaccine adjuvant, using a microfluidic mixer.3
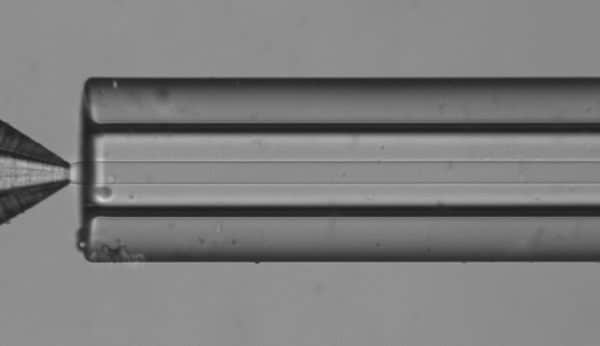
High throughput screening
Flow cytometry for single-virus analysis shows high potential in virology, vaccine development, and antiviral research. However, such analysis can be difficult to perform because fluorescence-activated cell sorting (FACS), the standard technique in modern biology, does not allow for single-virus measurements due to viruses’ small size.
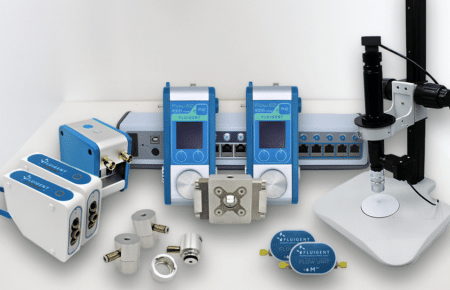
The Fluigent double emulsion production station is a robust and complete system for producing outstanding monodispersed double emulsions with a single device.
Droplet-based microfluidics combined with next-generation sequencing can allow for high-throughput screening of virus particles. For instance, Chaipan et al. have developed a droplet-based microfluidic platform to screen single virus particles for optimal antigenic features of vaccine candidates and demonstrated the platform’s use by screening HIV particles.4
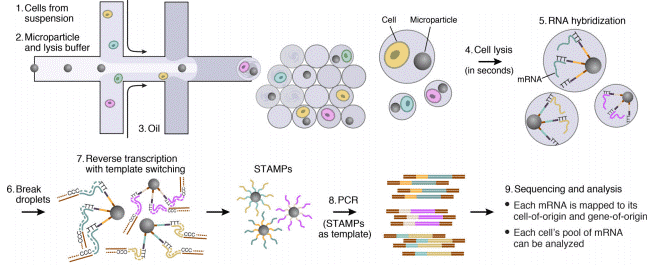
The Drop-Seq protocol is a high-throughput method that enables sequencing of mRNA from a large number of cells.
Virus detection and analysis
Finally, virus detection applications are of particular interest in vaccine development. The quantity of virus in a sample is typically quite low, and diluted in a mix of all kinds of proteins, DNA and RNA. An amplification step is therefore necessary to increase the quantity of detectable RNA. Polymerase chain reaction (PCR), and other PCR-related methods such as quantitative PCR (qPCR), amplify and quantify DNA and RNA for subsequent analysis. In contrast to standard PCR, digital PCR (dPCR) divides the sample into subsamples in the pico- to nanoliter range, allowing for more reliable collection and more sensitive measurement of nucleic acid quantities.
For example, Ahrberg et al. have developed an easy-to-use microfluidic dPCR device to amplify and quantify complementary deoxyribonucleic acid (cDNA) samples for the H7N9 influenza virus.5 In another study, researchers from the California Institute of Technology and MIT developed a microfluidic dPCR approach to physically link single bacterial cells harvested from a natural environment with a viral marker gene for examining virus-bacterium interactions in many different environments.6
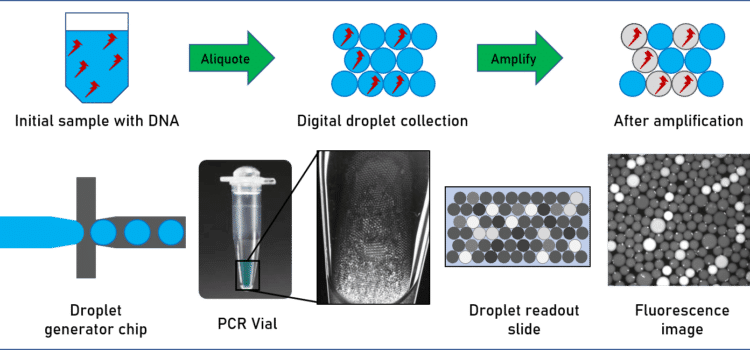
In-vitro cell analysis in vaccine research
Cell culture is at the center of many biological experiments, as it is the first step in most in-vitro analyses. The conditions in which the cells are cultivated determine the culture’s growth potential, protein secretion, and cell-cell signaling, and bulk cultures sometimes fail to effectively control these parameters.
Microfluidics provide unique capabilities to control the cellular microenvironment and present cells with mechanical and biochemical signals in a more physiologically relevant context. Microfluidic chips offer an ideal microenvironment to study the molecular- and cellular-scale activities that underlie human organ function and identify new therapeutic targets in vitro. For instance, Markus et al. used microfluidic cell culture chambers to analyze the hosting of varicella-zoster virus in human embryonic stem cell-derived neurons.7
References
- World Health Oganization. Global vaccine market report. 14 p (2019).
- Luthando Dziba, Isabel Sousa Pinto, Judith Fisher, K. T. IPBES Workshop on biodiversity and pandemics. (2020).
- Konishi, N. et al. Synthesis of Bisdesmosidic Oleanolic Acid Saponins via a Glycosylation-Deprotection Sequence under Continuous Microfluidic/Batch Conditions. J. Org. Chem. 82, 6703–6719 (2017).
- Chaipan, C. et al. Single-Virus Droplet Microfluidics for High-Throughput Screening of Neutralizing Epitopes on HIV Particles. Cell Chem. Biol. 24, 751-757.e3 (2017).
- Ahrberg, C. D., Lee, J. M. & Chung, B. G. Microwell Array-based Digital PCR for Influenza Virus Detection. Biochip J. 13, 269–276 (2019).
- Arbel D. Tadmor, Elizabeth A. Ottesen, Jared R. Leadbetter, and R. P. Probing Individual Environmental Bacteria for Viruses by Using Microfluidic Digital PCR. Science (80-. ). 23, 1–7 (2012).
- Markus, A., Lebenthal-Loinger, I., Yang, I. H., Kinchington, P. R. & Goldstein, R. S. An In Vitro Model of Latency and Reactivation of Varicella Zoster Virus in Human Stem Cell-Derived Neurons. PLoS Pathog. 11, 1–22 (2015).
Related content
A new level of technology
Microscopy and cell biology
Flow cells or microfluidic chips combined with a fluid perfusion system and microscopy are compatible with a variety of applications, including DNA and RNA hybridization, drug combination and long-term perfusion, and immunostaining.
Cell culture and Organ-on-a-chip
This area is an ideal microenvironment to study molecular and cellular-scale activities that underlie human organ function as well as identify new therapeutic targets in vitro.
Digital PCR
Microfluidic dPCR offers a new level of insight compared to quantitative PCR (qPCR). Droplet-based microfluidics is an excellent solution for partitioning a sample.
Want to learn more about the capabilities of microfluidics in life science? See Fluigent’s CEO France Hamber discuss microfluidic disruptive discoveries
Research applications
Microfluidics in biology and medicine
Microfluidics has emerged as a transformative technology, revolutionizing various areas of research, diagnostics, and therapeutics. By enabling precise manipulation and control of small volumes of fluids at the microscale level, microfluidic devices, also known as lab-on-a-chip, have opened up new possibilities in the study of cells, diagnostics, DNA sequencing, and drug discovery. In biology, microfluidics allows researchers to analyze and manipulate individual cells, paving the way for advancements in cell biology and single-cell genomics. In medicine, microfluidic platforms offer portable, rapid, and cost-effective point-of-care diagnostics, bringing healthcare to resource-limited settings, e.g. by using organ-on-chip platforms.
As an example, microfluidics in life science has accelerated RNA sequencing technologies, enabling high-throughput sequencing at reduced costs. In the application note linked below, Fluigent presents the Drop-Seq method, a high-throughput method that enables sequencing of the mRNA from a large number of cells. The Drop-Seq method pairs barcoded beads and cells in droplets, capturing cell-specific RNA on beads. Tagged cDNA is generated, amplified, sequenced, and bioinformatically analyzed. Barcode sequences identify cells, and transcript sequences are mapped to a reference genome, forming cell-specific gene-expression profiles.
Microfluidic tools for cell biological research
Cellular biology plays a crucial role in the field of medical science and drives innovation. A comprehensive understanding of how cells react during infections and pathological conditions is instrumental in the discovery of novel disease treatments. Essential to the analysis and visualization of cellular behavior are microscopy and imaging technologies. In the realm of cell biology, the integration of precise fluid flow control within microfluidic systems has revolutionized the study of cells by providing an automated platform that mimics their natural environment.
Microfluidics facilitates the delivery of fluids at controlled flow rates, minimizing errors. It finds applications in diverse areas such as RNA and DNA hybridization, enabling real-time imaging of gene expression in living cells. Microfluidics also contributes to drug combination therapies, long-term perfusion studies, and improved immunostaining protocols. By replacing traditional methods, microfluidics in life science offers several advantages including enhanced control, sensitivity, throughput, cost-effectiveness, and reduced material consumption. Its potential impact extends to cancer diagnosis, enhancing our understanding of cancer biology, and driving advancements in medical research.
Advantages of pressure-based flow controllers for life science experiments
Pressure-based flow controllers offer several advantages over peristaltic pumps and syringe pumps in microfluidics for life science applications. Firstly, it provides precise and accurate control of flow rates, allowing for better reproducibility and control of experimental conditions. Secondly, the pressure-based system is less prone to pulsations and variations in flow, resulting in more stable and consistent flow profiles. Additionally, using pressure-based controllers in life sciences allows researchers to work with much smaller volumes, which is useful when the samples to be studied are expensive or rare.
Finally, using pumps like the Flow EZ allows for use of various accessories such as reservoir mixers or block heaters, which can reproduce the physiological conditions of cells, for example, and keep the sample homogeneous, which is much more complex, if not impossible, with other types of pumps.
Organ-on-chip studies for life science
Organs-on-chips (OoC) are microdevices that mimic organ functions. They use microfluidics and 3D culture to replicate human physiology. OoC models show that dynamic culture conditions affect system maturation. They aim to recreate tissue barriers, parenchymal tissues, and inter-organ interactions. An OoC system includes a microfluidic chip with cell culture chambers, fluid channels, and optional components like membranes or gels. Biosensors and bio-actuators may be added. This technology is very useful for microfluidics in life science applications, as it offers more realistic lab modeling of organs and tissues. To that end, Fluigent has created Omi, a versatile and automated platform for organ-on-chip studies.
Omi allows for long-term cell culture with controlled shear stress conditions through continuous flow. It offers customizable and automated protocols for various functions, such as perfusion, recirculation, sampling and injection. This platform caters to the requirements of both novice cell culture researchers and experienced organ-on-chip researchers, addressing their needs for automation and reproducibility.
Microfluidic in Life Science Case Study
Hans-Knöll-Institut, New Antibiotics, Cultivation in Droplets
This project focuses on how Fluigent’s customers use microfluidics to achieve outstanding results in their technology experiments.
Our speakers are Prof. Dr. Miriam Agler-Rosenbaum (Head of Bio Pilot Plant Department), Dr. Sundar Hengoju, Dr. Dede Man from the Bio Pilot Plant Department of the Leibniz Institut for Natural Products Research and Infection Biology (Hans Knöll Institute).
- How are they trying to find new antibiotics?
- Why is this important for infection biology?
- How do they research natural products?
- What are these products exactly?
- How does microfluidics allow them to cultivate microbes in droplets?
- How does the technology increase their efficiency millions of times over?
- In which cases are pressure pumps better than syringe pumps?
- How can microfluidic droplets be stabilized?
Watch this episode to find out – and note that this is just one story told. There are many possible applications for microfluidics.
Related products
Research field
Fluid Degassing Device for Microfluidic System
Microfluidic Fluid Degassing Device
See the offer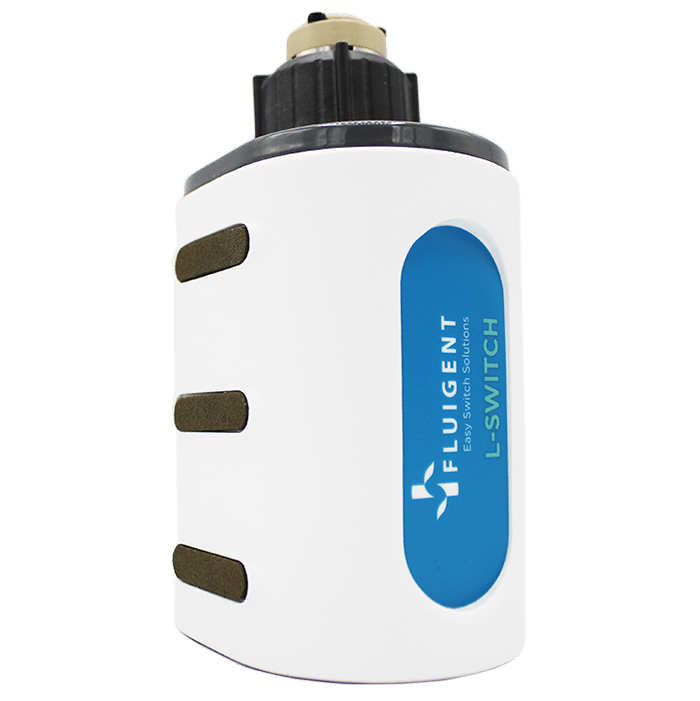
Microfluidic Injection Valve
L-SWITCH™ 6-port/2-position
See the offer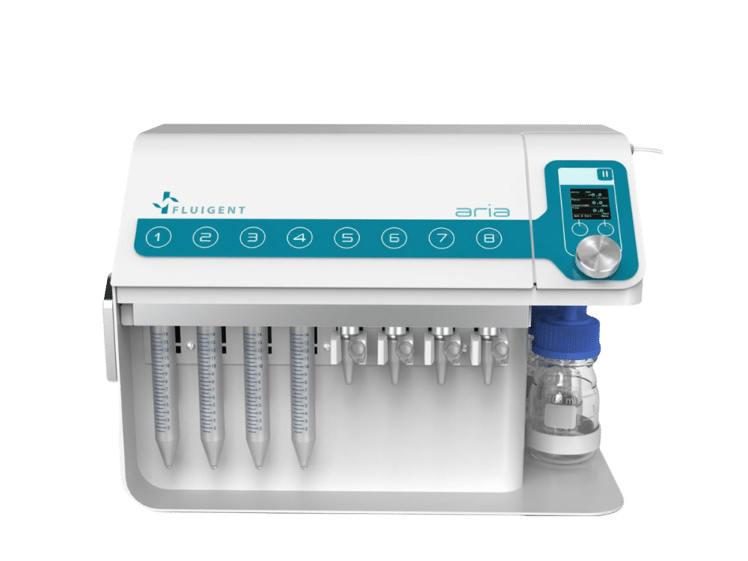
Automated Perfusion System for Spatial Omics
Aria
See the offer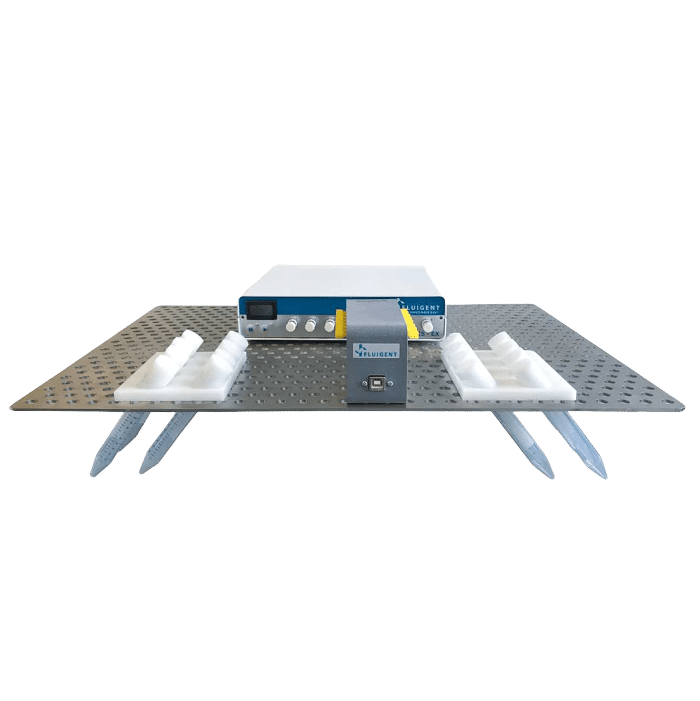
High Throughput Cell Perfusion Pack
High Throughput Cell Perfusion Pack
See the offer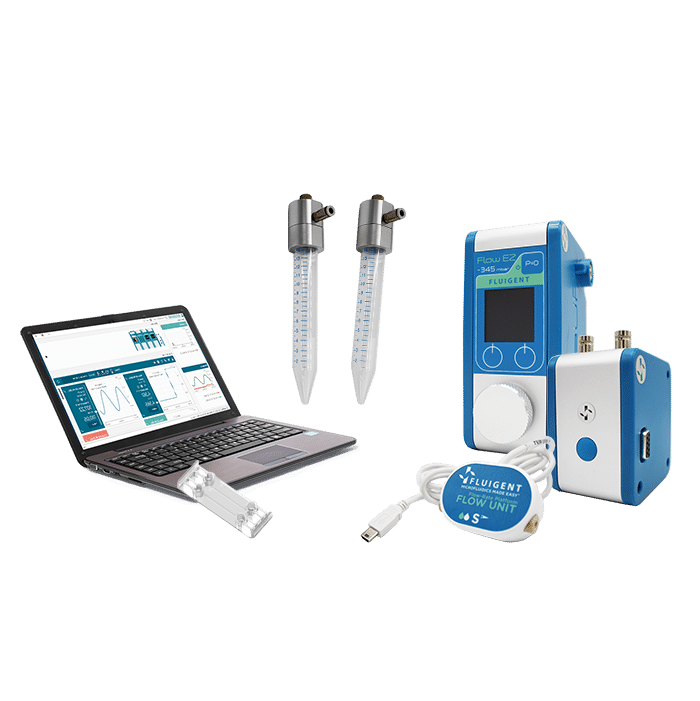
Organ on Chip Perfusion Pack
Perfect organ-on-chip cell perfusion set
See the offer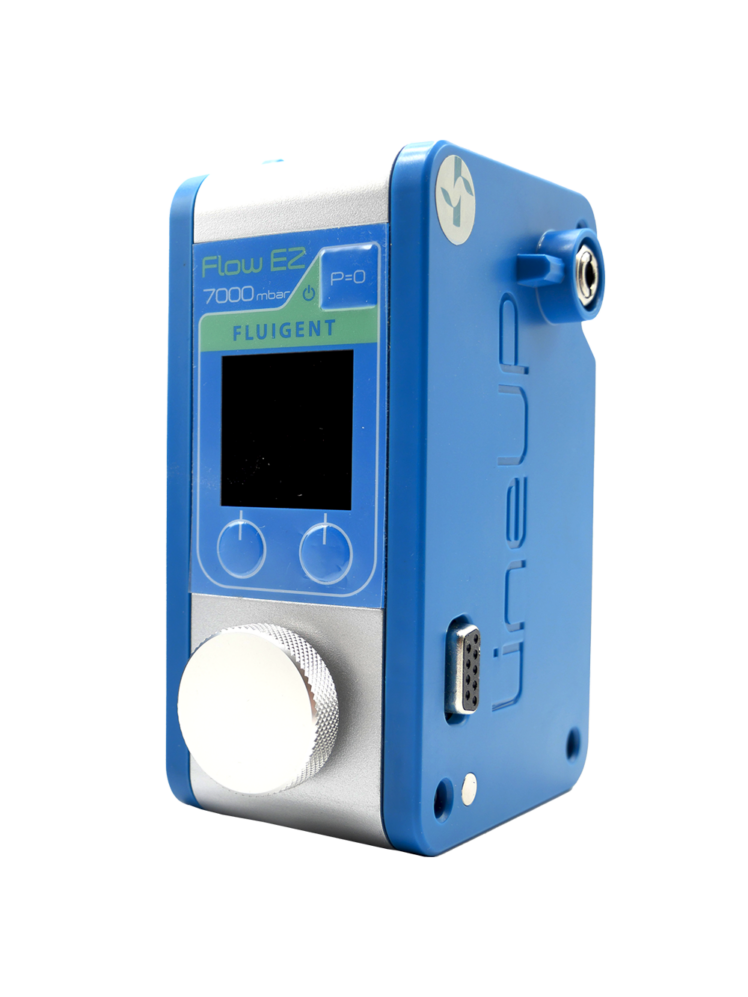
Microfluidic flow controller
Flow EZ™
See the offer
Microfluidic Recirculation Valve
L-SWITCH™ 6-port/2-position
See the offer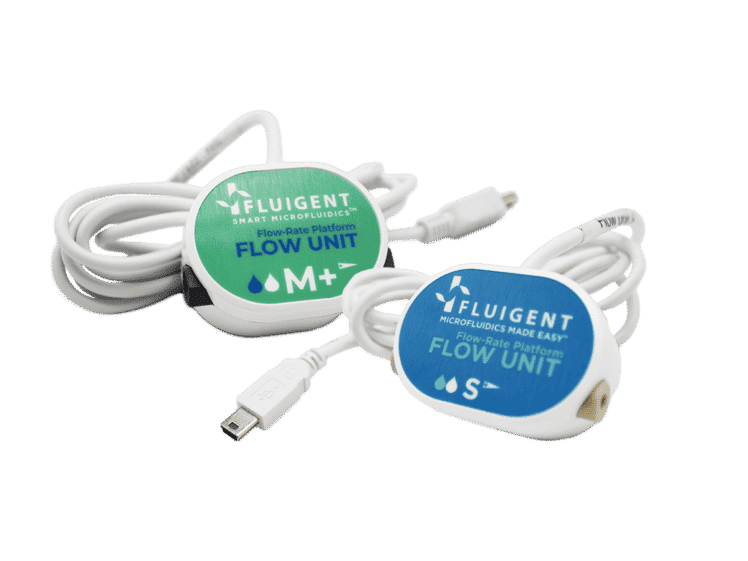
Bidirectional Microfluidic Flow Sensor
FLOW UNIT | FLOW UNIT +
See the offer
Microfluidic reservoir block heater
Heat fluid reservoirs during your microfluidic experiment
See the offer
Industrial field
Related Expertises
Looking for another market?
From the life sciences to the food industry, many applications require the use of fluids driven at flow rates from nanoliters to milliliters per minute. At such low flows, the success of these applications strongly depends on the level of control and automation of the fluidic operations.
These applications require flow control systems that are adapted for ensuring their success.
