Programmable Injections of Sweeteners with the Fluigent Flow-EZ for Tongue-on-a-chip Receptomics Taste Assay
The microfluidic receptomics-based tongue-on-a-chip platform assesses how taste receptors expressed in live cells respond to different sweeteners. This unique approach has the potential to bridge the gap between conventional assays and human taste panel studies, providing a consistent and a high-throughput receptomics taste assay for evaluating sensory responses to taste.
Receptomics a Novel Approach for Reproducible Sensory Panels
Dr. Jongsma’s team at Wageningen University has developed a tongue-on-a-chip platform based on an innovative microfluidic technique called receptomics. This technology permits the measurement of how various receptor proteins respond to different substances under controlled flow conditions.
The objective is to be able to predict the sense of taste in vitro accurately predicting panel experiments when quantities are low and purification or regulatory costs are high. In a recent publication by Dr. Roelse et al. (2024) [1], such a platform was used to evaluate known sensory attributes of sweeteners by analyzing receptor activation profiles.
The system employed a receptor cell array containing sweet and six bitter G protein-coupled receptors (GPCR receptors. These receptors were expressed in HEK293 live cells seeded onto a printed DNA grid—roughly one square centimeter in size—on a glass slide. Through reverse transfection, each spot on the array expressed a different receptor, forming a functional receptor cell array.
Dr. Roelse worked at Wageningen research for 17 years and then joined the startup InsectSense as partner and chief scientist officer (CSO) to further develop ReceptomiX technology and make it available for the labs across the world.

Figure 1: Receptomics Taste Assay Illustration
During testing, the array is exposed to pure and mixed sweeteners through a precisely controlled flow. Using FRET imaging and a mapped concentration gradient, the platform captures calcium signaling responses in real time.
This allows researchers to reproduce key sensory features such as sweetness thresholds, onset, lingering effects, and bitter off-notes.
How to Optimize the Sample Exposure Control Parameter
The microfluidic system consists of tongue-on-a-chip receptor flow cell connected to a pressure-based Fluigent pump with a flow sensor to keep the reagent perfusing at a steady rate.
Samples were delivered using an injection loop with a fixed volume, which makes it possible to control how long the cells are exposed to the sample, based on flow speed and the size of the flow chamber.
To understand how the sample spreads through the flow cell, the team used fluorescein dye in an empty chip to establish the reference.
The purpose of this test is to evaluate:
- How quickly the dye enters (rise)
- How long it stays (peak width)
- How quickly it clears out (fall).
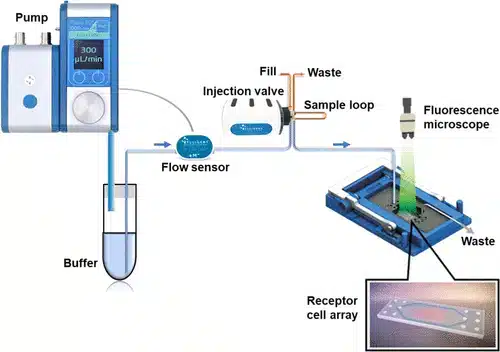
Figure 2: Scheme of Microfluidic Loop with FlowEZ Pressure Controller


The curves in Figure 3 confirm that the system consistently delivers the dye with very little variation, less than 1 second difference between repeats at full width at half maximum (Δfwhm). The flow dynamics created gradual sigmoid entry and exit curves, rather than perfectly square pulses.
This is a result of laminar flow and diffusion effects as the dye moves through narrow channels as well as slight timing differences when the dye reaches all replicated receptor spots of the cell array.

Figure 3 Microfluidic System Calibration Curve with Fluorescein Dye Injection
As shown in Table 1, actual exposure times closely match theoretical predictions under most conditions, particularly at lower injection volumes. The values in bold correspond to the selected experimental conditions
Table 1. Results of Flow Cell Volume, Injection Volume and Flow Speed Calibration
| Flow cell volume in μL | Injection volume in μL | Flow speed in μL/min | Theoretical exposure time in s | Fwhm in s | Maximum rise/s in % | Maximum fall/s in % |
|---|---|---|---|---|---|---|
| 50 | 300 | 100 | 180 | 185 (±1) | 2.4 | -1.3 |
| 50 | 300 | 300 | 60 | 60 | 5.0 | -3.3 |
| 50 | 300 | 600 | 30 | 30 | 10.3 | -6.0 |
| 50 | 300 | 900 | 20 | 21 | 15.8 | -8.3 |
| 100 | 300 | 100 | 180 | 186 (±1) | 2.1 | -1.3 |
| 100 | 300 | 300 | 60 | 59 | 4.5 | -3.4 |
| 100 | 300 | 600 | 30 | 31 | 8.9 | -6.8 |
| 100 | 300 | 900 | 20 | 20 | 10.9 | -8.2 |
*Partial results table for full data please consult the full research paper
Regardless of the flow rate or injection size, the signal always rose faster than it fell. The rise part occurs during filling of the flow cell with dye. This is faster than the clearing out phase due to the extra mixing and diffusion occurring in the wider dimensions of the flow cell and the extra time. Higher flow rates produced steeper slopes, with rise values increasing from 2.1%/s at 100 μL/min to 10.9%/s at 900 μL/min, and fall values becoming more negative accordingly—from –1.3%/s to –8.2%/s. The peak widths, particularly at moderate flow rates, remained close to the predicted exposure times, confirming the reliability of the fluidic system in delivering controlled sample durations.
Sweet Receptor Response Onset and Lingering
In the tongue-on-a-chip taste assays, FRET (Förster Resonance Energy Transfer) images for CFP and YFP channels (reporting GPCR activation via the Twitch2B calcium sensor) were collected and processed in ReceptomX software as described by Wehrens et al. (2019) [2]. The spots with fewer than 15 fluorescent pixels or receptor types with fewer than five replicates were excluded to ensure data quality.
After smoothing and interpolating to correct for timing offsets between CFP and YFP frames, each spot’s response was calculated as the iRatio—the difference between its baseline and peak CFP/YFP ratio.
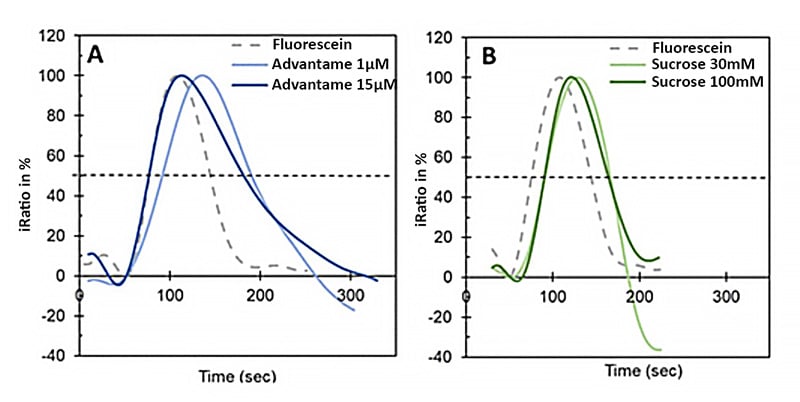
Figure 4 . Sweet Receptor Response Profiles Calibrated for the Ligand Concentration Relative to a Fluorescein Injection (dashed line). Advantame (A) and sucrose (B).
In each test, fluorescein dye was injected as a reference to tracking the cellular response. All signals were scaled so that the highest response was set to 100%, and the start of each injection was aligned to the same time point (T = 50 seconds). Each experiment combined three responses:
- the reference fluorescein injection
- a medium-level sweetener dose (around the EC50)
- a higher dose that triggered a strong, maximum response.
While the calcium signal in the cells started to rise as the fluorescein entered, the peak response usually happened a little later. This delay may reflect the time for cells to fully react, which is measured as a sweetener induced calcium peak (e.g., advantame: 5 ± 2 s; sucrose: 13 ± 2 s).
To make this timing measure reliable and easy to compare between experiments, the samples should be exposed for a short and consistent duration, helping to avoid broad or messy response curves. The lingering on the other hand was measured as the difference in full width at half maximum (Δfwhm) relative to fluorescein (e.g., advantame: 39 s; sucrose: 6 s).
Although these absolute times are shorter than human sensory values, the relative onset and lingering rankings mirror panel data. This consistency indicates that the tongue-on-a-chip can effectively model the relative taste kinetics observed in humans.
Conclusion
The tongue-on-a-chip platform, powered by receptomics and programmable microfluidic control, offers a reproducible and high-throughput method to evaluate taste receptor responses in vitro. It successfully captures key sensory attributes such as onset and lingering, closely mirroring human perception rankings. This system holds promise for advancing food science by complementing or even replacing traditional taste panels.
To explore the full experimental results, data, and applications of this innovative platform, we invite you to read the complete paper.
👉 Ready to integrate flow control technology into your workflow? Contact our experts or explore our microfluidic pressure control systems.
Related Products

Expertises and resources
-
Microfluidic Application Notes Controlling Flow Rate and Shear Stress with Omi™ to Study Endothelial Cell Response Read more
-
Microfluidics Case Studies Automated immunolabeling to perform highly multiplexed tissue imaging with ARIA Read more
-
Microfluidics White Papers A review of Organ on Chip Technology – A White Paper Read more
-
Expert Reviews: Basics of Microfluidics Why Control Shear Stress in Cell Biology? Read more
-
Microfluidic Application Notes Droplet Sequencing: Drop-Seq method Read more
-
Expert Reviews: Basics of Microfluidics Prostate Organoid Culture in Microbeads Read more
-
Expert Reviews: Basics of Microfluidics Application of microfluidic chip technology Read more
References
[1] Roelse M, Krasteva N, Pawlizak S, Mai MK, Jongsma MA. Tongue-on-a-Chip: Parallel Recording of Sweet and Bitter Receptor Responses to Sequential Injections of Pure and Mixed Sweeteners. J Agric Food Chem. 2024;72(28):15854–15864. doi:10.1021/acs.jafc.4c00815
[2] Wehrens R, Roelse M, Henquet M, van Lenthe M, Goedhart PW, Jongsma MA. Statistical models discriminating between complex samples measured with microfluidic receptor-cell arrays. PLoS One. 2019;14(4):e0214878. doi:10.1371/journal.pone.0214878