Multi-parametric Functional Assays of Cardiac Organ-on-a-Chip using Live-cell Microscopy and Fluigent, Aria
Cardiovascular diseases, such as coronary artery disease, stroke and aneurisms, remain a leading health related cause of death globally [1] [2]. In addition, cardiac toxicity is one of the major contributors to late-stage drug attrition in clinical testing [3]. Therefore, there is an urgent need for physiologically relevant and reproducible in vitro models. The detailed protocol published in Nature Protocols (Garcia et al., 2025) showcases robust workflow for the maturation of human induced pluripotent stem cell (hiPSC) for cardiac organ-on-a-chip (OOAC) systems. Designed to be accessible beyond the cardiac and microfluidics research communities, the protocol aims to accelerate broader adoption of OOAC technologies.
This case-study shows the application of the Aria platform in a live-cell imaging protocol, specifically for Ca²⁺ transient imaging assays, one of the three functional readouts presented.
General Outline for Creating Cardiac OOAC Microtissue
The full protocol, published in Nature Protocols (2025)*, provides a detailed roadmap with exact timing (of ~40 days of the protocol execution) to create and test the mature cardiac microtissues in OOACs.
The five major stages are:
- Maintenance of hiPSC lines (WTC11-GCaMP6f cells)
- Differentiation into cardiomyocytes
- Loading into microfluidic OOAC chambers
- Maintenance and characterization of OOAC model
- Functional assays using live-cell microscopy
The platform incorporated image-based functional readouts for validating and standardization. Imaging is performed on inverted fluorescence microscopes (Zeiss Axio Observer) equipped with high-speed cameras (>65 frames per second) and live-cell incubation systems to maintain 37 °C and 5% CO₂ throughout acquisition.
Functional performance parameters:
- Contractility: Brightfield microscopy tracks tissue displacement, contraction velocity, and beat frequency.
- Intracellular Calcium: GCaMP6f-based fluorescence provides high-fidelity calcium imaging readouts.
- Electrophysiology: The BeRST dye (FarRed) allows non-invasive action potential imaging.
These outputs are quantified using custom Python and MATLAB scripts reflect on the physiological measurable parameters to reflect the excitation-contraction coupling and action potential dynamics.
*Garcia MI, Dame K, Charwat V, Siemons BA, Finsberg H, Bhardwaj B, et al. Human induced pluripotent stem cell-derived cardiomyocytes and their use in a cardiac organ-on-a-chip to assay electrophysiology, calcium and contractility. Nat Protoc. 2025 Apr 7; Available from: https://doi.org/10.1038/s41596-025-01166-4
Protocol for Integration of Aria for Ca2+ Imaging Assay
Stage 5 of the protocol focuses on live imaging of cardiac microtissues to evaluate functional properties such as contractility, intracellular calcium flux, and electrophysiology. These microtissues are generated from hiPS cells expressing GCaMP(a genetically encoded calcium indicator), which enables direct visualization of calcium transients via fluorescence.
The protocol uses the Aria automated perfusion system to deliver a range of extracellular calcium concentrations during imaging. These concentrations, ranging from 0.125 to 2.0 mM Ca²⁺ (see Table 1 for exact dilutions) to trigger to test the contractility parameters.
Table 1: Dilution for Tyrode’s Solution
| n | Stock solution | Tyrode’s with Ca²⁺ (mL) C-7650F | Tyrode’s without Ca²⁺ (mL) C-7651F | Tyrode’s with Ca²⁺ working solution (mM) | BeRST working solution (50 nM) | Working volum |
|---|---|---|---|---|---|---|
| 1 | 5 mM stock | 1 | 1.5 | 2 | 0.250 mL | 2.5 mL |
| 2 | from dilution 1 | 1.25 | 1.25 | 1 | 0.250 mL | 2.5 mL |
| 3 | from dilution 2 | 1.25 | 1.25 | 0.5 | 0.250 mL | 2.5 mL |
| 4 | from dilution 3 | 1.25 | 1.25 | 0.25 | 0.250 mL | 2.5 mL |
| 5 | from dilution 4 | 1.25 | 1.25 | 0.125 | 0.250 mL | 2.5 mL |
| 6 | 5 mM stock | 500 µL | 19.5 | 0.125 | No dye | 20 mL |
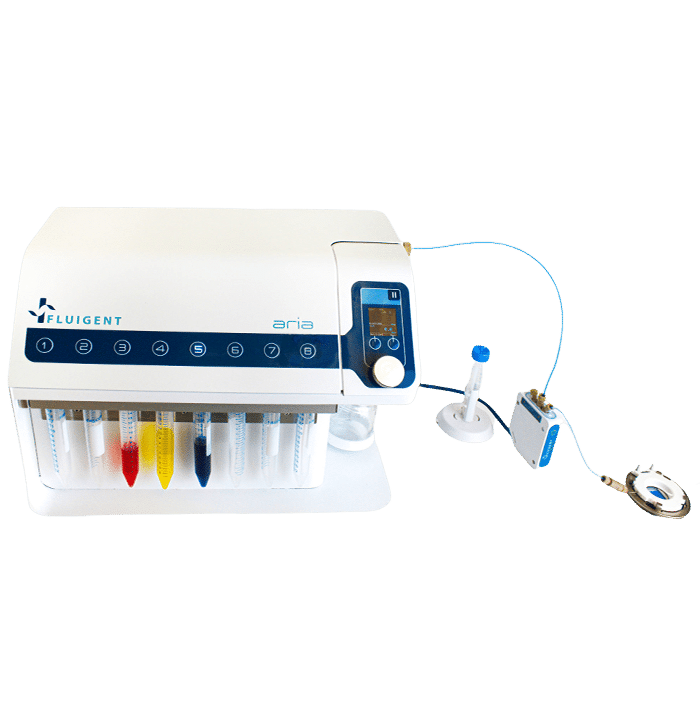
The set up illustrated in the Figure 1 minimizes bubble formation and protects the tissue by maintaining uninterrupted microchannel flow. The prefill feature primes the system with experimental solutions. Integration with imaging systems and the electrical stimulating pacemaker on the microscope stage platform mimics relevant stressors and offers a robust, reproducible method for assessing the performance of cardiac microtissues in health and disease models.
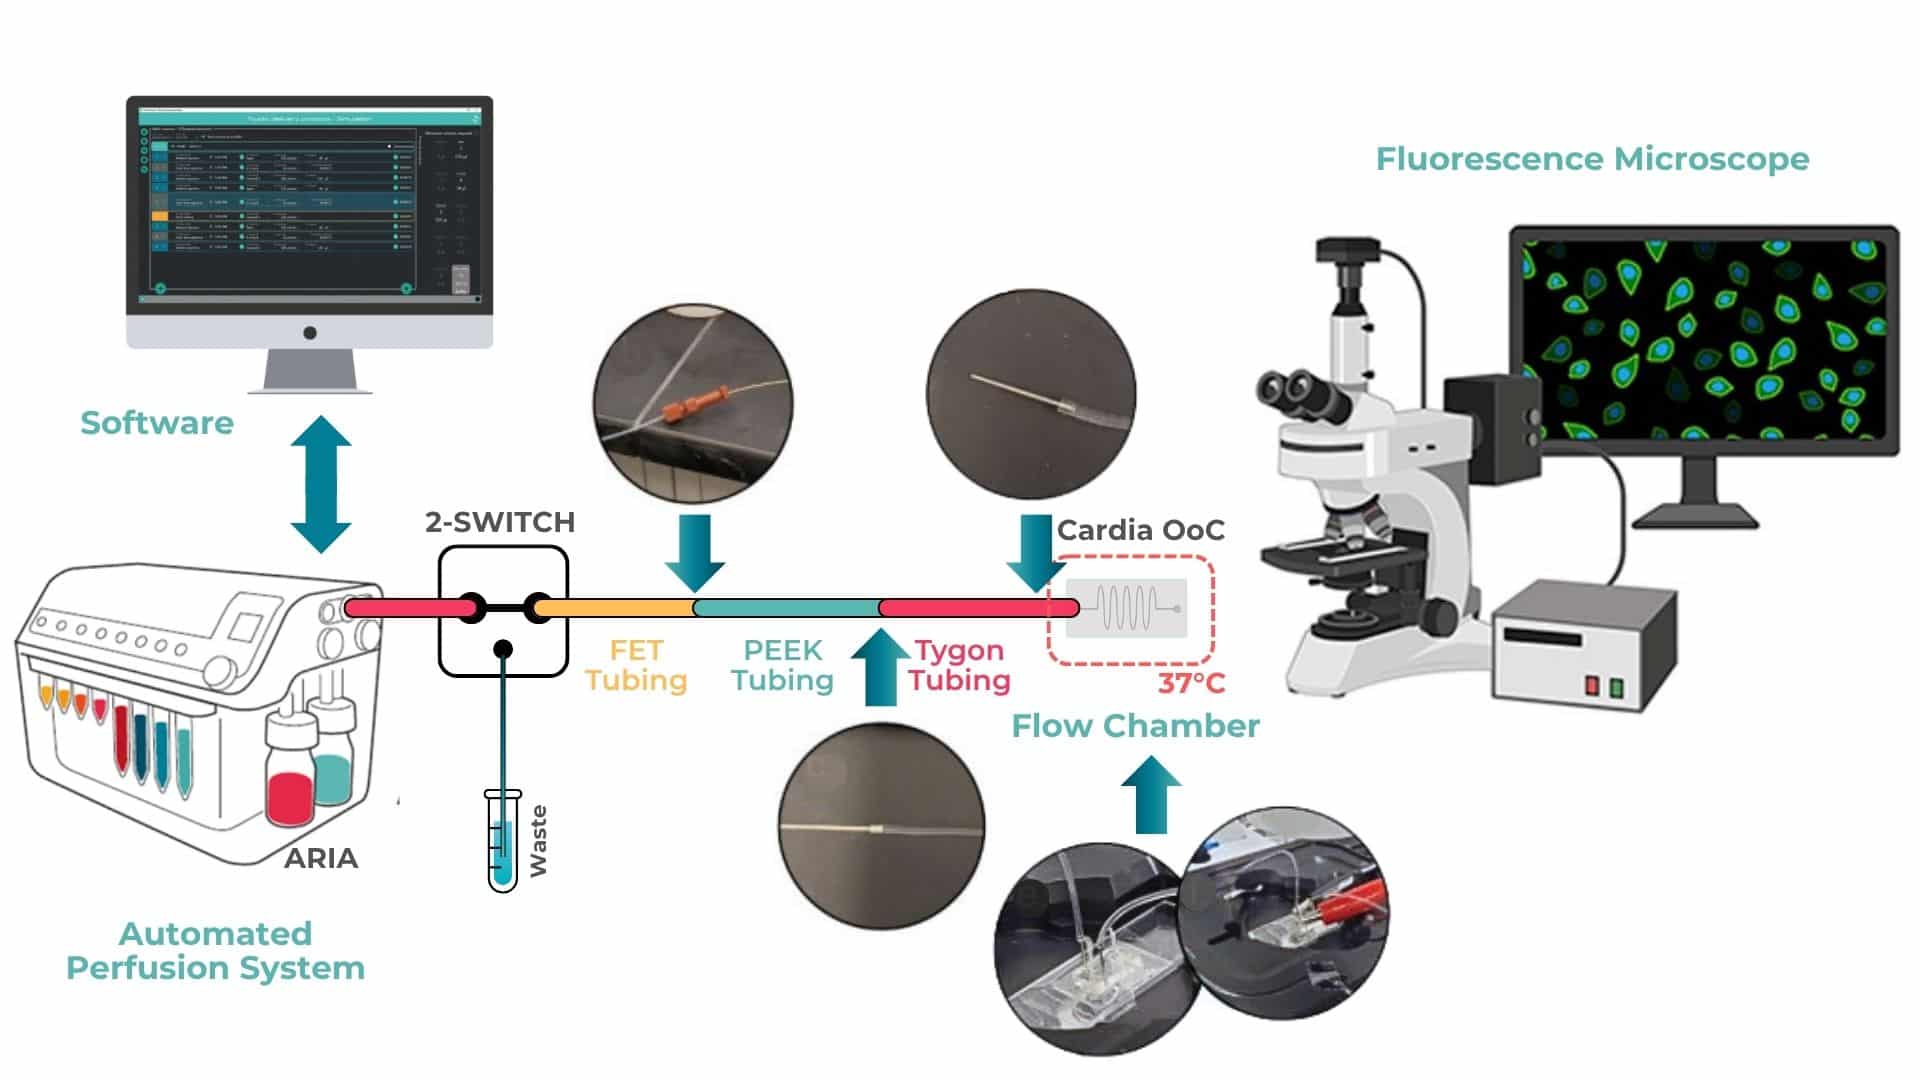
Figure 1: Integrating Aria with Cardiac OOAC on heated microscopy stage *Adopted from the Supplementary Figure 4.
Cardiac OOAC device is mounted onto a slide holder using double-sided adhesive tape to ensure stability during microscopy. The PDMS chip is connected via autoclaved stainless-steel connectors, which are directly inserted into the inlet and outlet ports of the device.
Tubing connections are configured as follows: fluorinated ethylene propylene (FEP) tubing from the Aria automated perfusion system is connected to polyetheretherketone (PEEK) tubing. The PEEK tubing is inserted into flexible Tygon tubing, which is then connected to the PDMS chip via stainless steel needles.
For electrical pacing, alligator clips from the pacing unit are attached to embedded metal wires located at both the inlet and outlet of the cardiac OOAC. The entire system is placed on a heated microscopy stage, using custom plate holders to maintain the physiological temperature of 37 °C throughout the experiment.
Aria control software was used to program and execute timed perfusion sequences, ensuring consistent and repeatable exposure of the cardiac microtissues to defined extracellular calcium concentrations. Microscopy videos were acquired during the final 20 seconds of each perfusion step (steps 2, 4, 6, 8, and 10), following a 20-second period of pre-conditioning via electrical pacing.
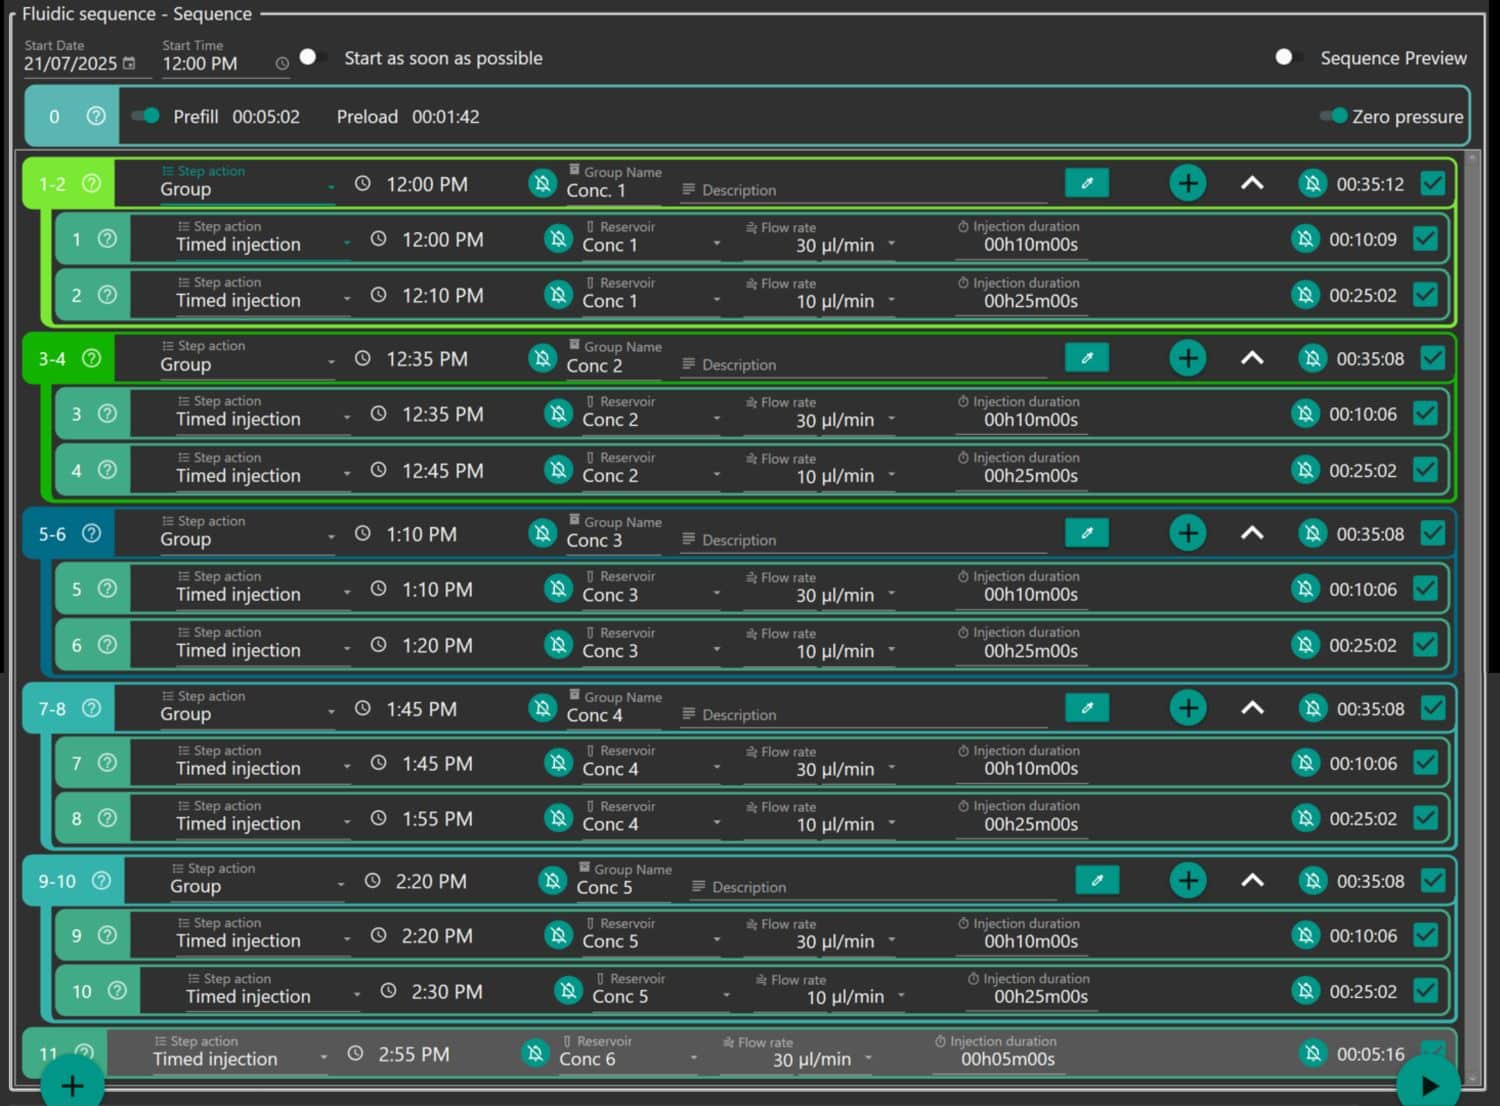
Figure 2: Aria Protocol Grouped by the Concetration of Tyrode’s Solution.
For researchers interested in integrating this workflow with automated imaging systems, please see the following resources:
- For synchronization with microscope control software (Zeiss ZEN) is possible via TCP/IP communication. We explaine everything in our recent webinar on high-resolution microscopy with Zeiss.
- To manually set-up TTL communication protocols, read our application note.
Results: Relevance to Cardiac Disease Modelling
The functionality of cardiac organ-on-a-chip (OOAC) systems was assessed using live-cell microscopy, enabling non-destructive imaging of beating cardiac microtissues. Within 10 days of loading differentiated hiPSC-derived cardiomyocytes into the OOAC, tissues developed into synchronously contracting microtissues that nearly filled the enclosed cell chamber.
To capture cardiac function at multiple levels, the protocol utilized a multi-parametric imaging strategy. The genetically encoded calcium indicator GCaMP6f (expressed in WTC11 hiPSC-derived cardiomyocytes) enabled high-sensitivity detection of intracellular calcium transients via green fluorescence (eGFP channel). In parallel, membrane voltage dynamics were monitored using the red fluorescent BeRST voltage-sensitive dye, which was imaged in the FarRed channel. These imaging modalities captured cyclic changes related to contraction, calcium signaling, and electrical activity, offering a comprehensive view of cardiac performance in vitro.
- Brightfield videos were used to quantify mechanical contraction parameters such as displacement, contraction velocity, and relaxation velocity.
- GCaMP6f fluorescence was used to monitor calcium transient amplitude and kinetics.
- BeRST imaging enabled analysis of action potential duration (APD) and repolarization dynamics.
A representative video (Video 1) demonstrates that after a 20-minute rest period on the microscope stage, the microtissues resumed spontaneous rhythmic contractions, returning to baseline beating frequency and amplitude. This observation emphasizes the time needed for tissue recovery set in the protocols and confirms that the assay platform is non-disruptive and compatible with repeated imaging.

Calcium Dose-Response: Functional Sensitivity to Extracellular Ca²⁺
Tyrode’s solutions with varying extracellular calcium concentrations (ranging from 0.125 to 2.0 mM) during electrical pacing at 1.2 Hz. Changes in calcium levels elicited dose-dependent responses across all measured functional parameters, demonstrating the model’s sensitivity to physiologically relevant ionic shifts.
As shown in Figure 3:
- Calcium transient amplitude, as measured by eGFP fluorescence, increased with rising extracellular calcium levels.
- Contraction displacement also increased proportionally, with higher calcium promoting stronger tissue contractions.
- Both contraction velocity and relaxation velocity improved at elevated calcium concentrations, reflecting enhanced excitation–contraction coupling.
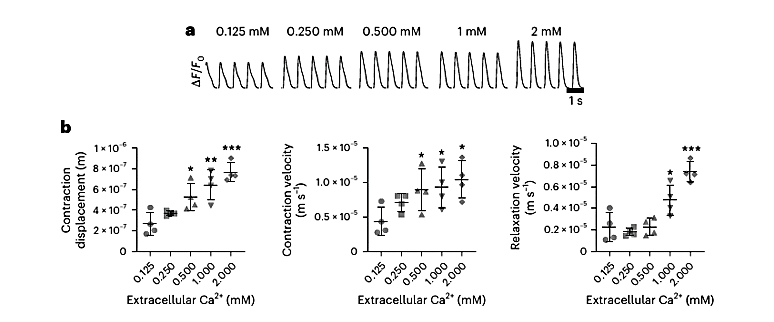
Figure 3: (a) Fluorescent intensity of (eGFP) within perfused OOAC with varying concentration of Tyrode’s solutions with electrical stimulation set at 1.2 Hz. (b1) Quantification of contraction displacement. (b2) The average contraction velocity. (b3) The average relaxation velocity.
Electrophysiological Effects of Calcium on Action Potentials
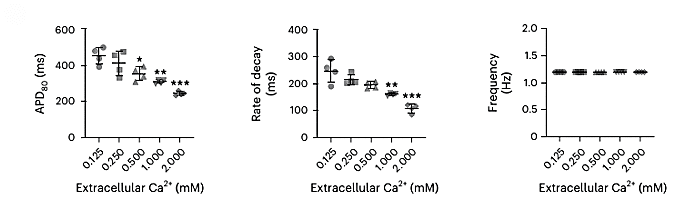
Figure 4: Response of Action Potential Duration (APD) and Fluorescent Rate of decay
In addition to mechanical and calcium handling responses, the effect of extracellular calcium on membrane electrophysiology was quantified using BeRST fluorescence. As shown in Figure 4, increasing calcium concentration was associated with:
- A reduction in action potential duration (APD80), indicating faster repolarization.
- A decrease in the fluorescent decay rate, suggesting shorter depolarization–repolarization cycles.
These changes are consistent with known calcium effects on ion channel activity and cardiac electrophysiology. Furthermore, BeRST imaging revealed enhanced repolarization speed at higher pacing rates. This could indicate increased susceptibility to arrhythmias under stress conditions.
Note: All data shown (Figures 3 and 4) were obtained from the Figure 6 of the original article Nature Protocols (Garcia et al., 2025). Statistical significance is indicated as follows: *P < 0.05, **P < 0.005, ***P < 0.0005 (unpaired t-test), n = 4 OOAC replicates per condition.
Conclusion
This protocol used the Aria system within a cardiac OOAC platform. The integration of Aria allowed precise calcium modulation for physiological interrogation of microtissue behavior. The protocol described is adaptable and holds strong relevance for applications in:
- Drug cardiotoxicity screening
- Patient-specific disease modeling
- Bioengineering cardiac testbeds
To explore the details on the biological set up and maturation of cardiac hiPSC, access the full article here.
References
[1] S. L. Murphy, K. D. Kochanek, J. Xu and E. Arias, “Mortality in the United States, 2023,” NCHS Data Brief, 2024.
[2] ”Cardiovascular diseases,” World Heath Organization (WHO), 2025. [Online]. Available: https://www.who.int/health-topics/cardiovascular-diseases#tab=tab_1.
[3] F. Nicola, S. Peter, C. Alberto, H. Joerg, L. Amir and B. Renee, “Drug attrition during pre-clinical and clinical development: Understanding and managing drug-induced cardiotoxicity,” Pharmacology & Therapeutics, vol. 138, no. 3, pp. 470-484, 2013. https://doi.org/10.1016/j.pharmthera.2013.03.005.
Related Solutions

Related content
-
Expert Reviews: Basics of Microfluidics Optimizing Microfluidic Perfusion: Best Practices and Innovations Read more
-
Microfluidic Application Notes Automating calcium imaging in neural cells with Fluigent’s Aria Read more
-
Microfluidic Application Notes Automating Neuronal Cell Immunofluorescence in Microfluidic Chips Read more
-
Microfluidics Case Studies Automated immunolabeling to perform highly multiplexed tissue imaging with ARIA Read more
-
Tutorial videos ARIA Tutorial Episode 1 : How To Plug An ARIA [automated cell perfusion] – Fluigent Read more
-
 Microfluidics White Papers A review of Organ on Chip Technology – A White Paper Read more
 -
Microfluidic Application Notes Cancer Cell Analysis Made Easy with Aria: cell Capture and Labeling Read more
-
Microfluidics Case Studies CEA/CNRS: A flow cell for nanoscopic imaging in liquid Read more