Microfluidics for Transmission Electron Microscopy: Characterization of Copper Electrodeposition
Coupling microfluidics to Transmission Electron Microscopy integrates liquid flow capabilities within microfabricated liquid cells, providing the means to study different processes in solution with sub-nanometer spatial resolution and sub-microsecond temporal resolution.
This application note presents the Liquid-phase Transmission Electron Microscopy (LPTEM) technique, which makes it possible to visually study phenomena in areas ranging from materials science to life sciences.
There are several key advantages for the LPTEM, including:
- Control over liquid environments in a micro- or nanoscale space
- The ability to study dynamic processes in the liquid phase with nanoscale spatial resolution
- The ability to analyze chemical composition in-situ
- The ability to obtain electronic structure information
We kindly thank DENSsolutions for this collaboration, and for sharing the results obtained with their system.
What is Liquid-Phase Transmission Electron Microscopy?
Liquid-phase transmission electron microscopy (LPTEM), also known as in-situ liquid-phase transmission electron microscopy, is a powerful in situ visualization technique for directly characterizing nanomaterials in the liquid state. This technique currently enables researchers to visually study phenomena in a variety of fields, from life sciences to materials science. Examples of phenomena that can be measured with this technique are biomineralization processes, material changes during battery cycling, growth of metallic nanoparticles or structures in liquid, and electrochemical processes such as metal deposition.
The objective of LPTEM is to observe and study the behavior and dynamics of materials in a liquid environment at the nanoscale level.
What is the difference between conventional TEM and liquid-phase TEM?
In conventional TEM, the sample is typically prepared in a vacuum, which makes it difficult to study materials in their natural state. LPTEM overcomes this limitation by allowing the observation of materials in liquid environments, which can provide important insights into their properties and behavior.
Controlled microfluidics for LPTEM
However, existing LPTEM techniques frequently suffer from a lack of fluidic control and undesirable electron beam irradiation effects, which limits the use of analytical TEM approaches and produces irreplicable experimental results. To solve this problem, we use the precision and control of microfluidics in our transmission electron microscopy experiments.
Metallic or alloy nanostructures show benefits from increasing the contact area with the reaction medium and accelerating mass/ion transportation in chemical or electrochemical reactions. Direct observation of formation processes, as well as in-situ characterization of nanostructures to monitor the evolution of structural parameters, are crucial to producing materials that deliver optimized performance.
To control this parameter evolution reliably and efficiently, DENSsolutions, in collaboration with Fluigent, implemented an LPTEM system employing pressure-based flow controllers and a dedicated Nano-Cell design. This system, which applies microfluidics to transmission electron microscopy experiments, ensures a constant and well-defined flow to the sample area and enables full control of the liquid environment. As a result, the user is able to reliably measure the correlations between materials processing, structure, properties, and performance, while also observing real-time dynamics in liquid as a function of either heat or biasing.
Constructing a Liquid-Phase Transmission Electron Microscopy setup
Materials
Flow control:


Microscopy:
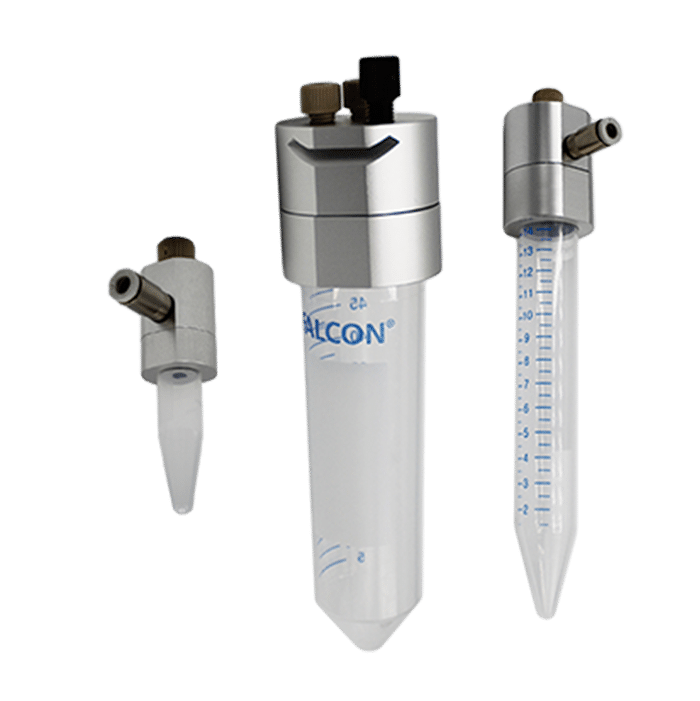
Liquid cell
The Stream Nano-Cell is an advanced flow cell for controlling the liquid environment within the microscope.
Sample holder
The in-situ TEM Sample Holder provides the platform for connecting the pressure-based flow controller to the Nano-Cell.
TEM
FEI Titan 80-300.
Liquid sample
CuSO4 (20 mM) and KH2PO4 (10 mM) mixed aqueous solution.
Methods
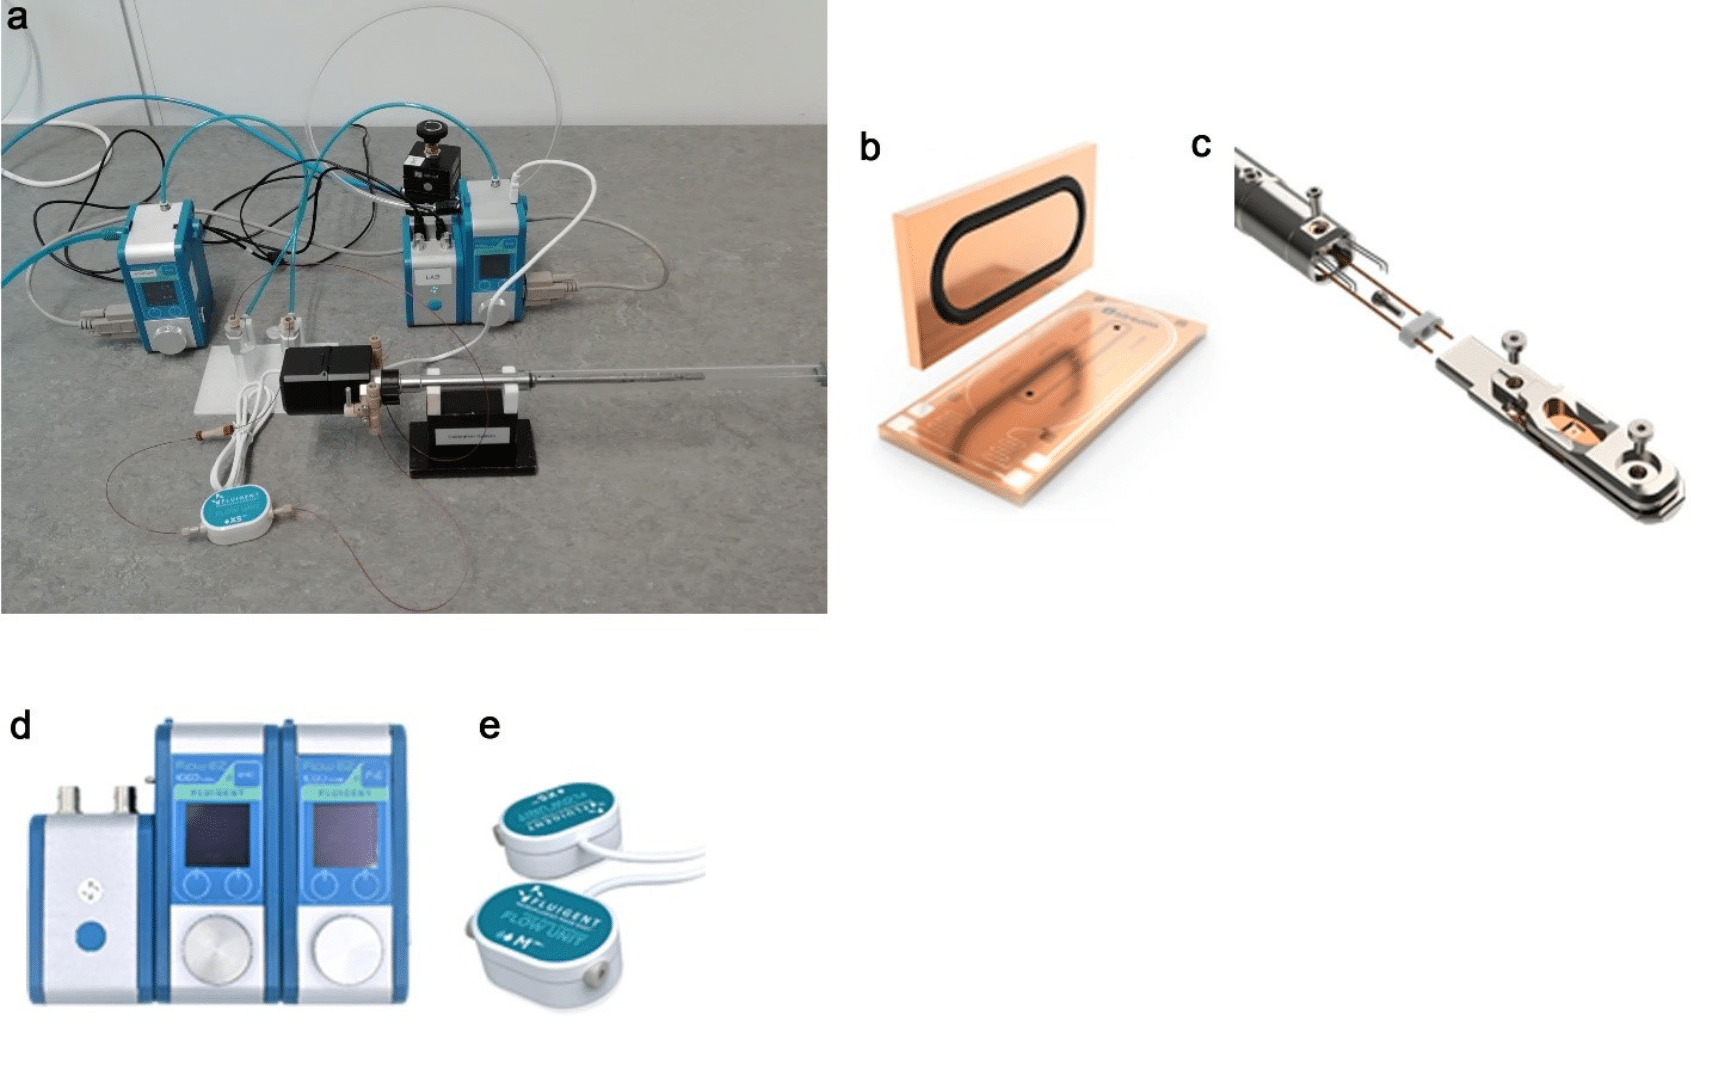
Figure 1. (a) Full setup of the system consisting of the Stream Nano-Cell (b) placed within the TEM Sample Holder (c), The LineUp microfluidic flow controllers consisting of two Flow EZ and a LINK (d), and a Flow Unit XS (e). The flow rate can be locally controlled using the Flow EZ display or by linking the Flow EZ to a computer and using OxyGEN software.
Result
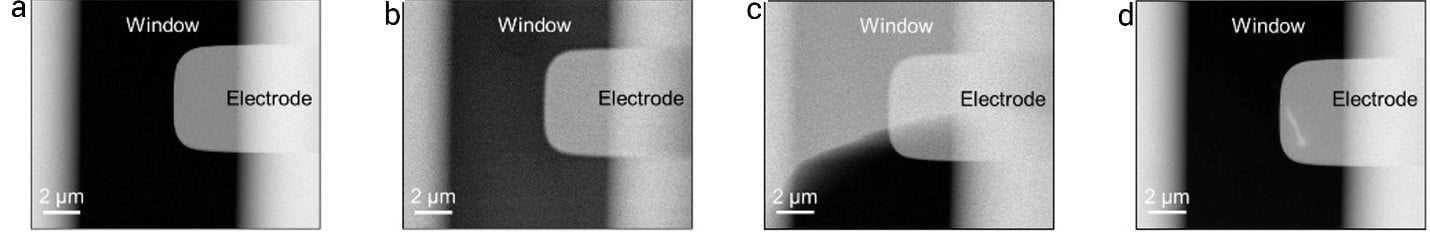
I. Controlling liquid flow and thickness within the microfluidic chamber
The use of liquid-phase transmission electron microscopy brings a high level of control and reproducibility to metal characterization experiments.
To demonstrate the high level of liquid control within the microfluidic chamber, the electrolyte was flowed into the window area and subsequently evacuated using the system described in the “Materials & Methods” part of the application note.
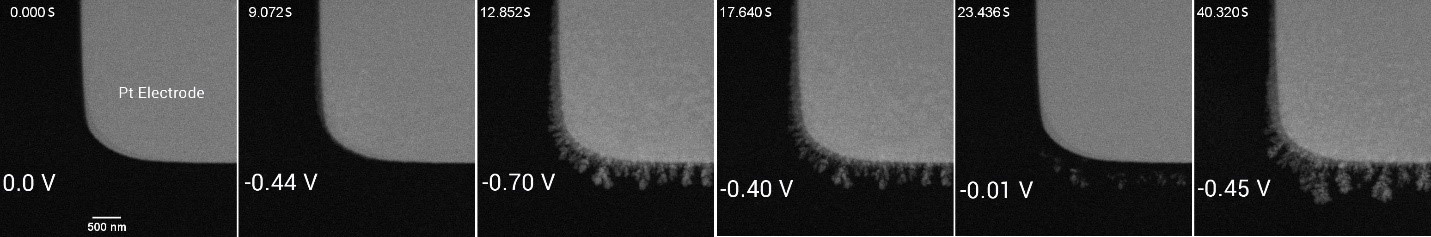
II. Growth and morphology evolution of Cu dendrites
After flowing the electrolyte, the cyclic voltammetry technique was used to study the electrodeposition of Cu. To do this, the electrolyte was injected using a flow rate of 1.7 µL/min, and voltage ranging from -0.70 V to 0.30 V was applied to the Pt electrode.
III. Microstructure and chemical composition analysis
As mentioned above, using liquid-phase TEM makes it possible to monitor and control the metal electrodeposition process with high precision.
To analyze the microstructure and chemical composition, SAED analysis was performed. Because a dry or thin liquid state is required for electron diffraction, the liquid is first pushed out from the microfluidic chamber. After electrodeposition, the diffraction rings for polycrystal were resolved. The indication of 220 diffraction means that a lattice resolution of ~1.28 Å or better can be obtained in the liquid thickness of ~100 nm.
Finally, the chemical composition of the resulting depositions is directly analyzed in the liquid phase. EDX elemental analysis (point, line, or area analysis) is conveniently performed. Figure 4e shows the HAADF-STEM EDX elemental mapping, displaying the spatial distribution of the Cu dendrites and the Pt electrode in the electrolyte and confirming the highly successful functioning of this analysis.
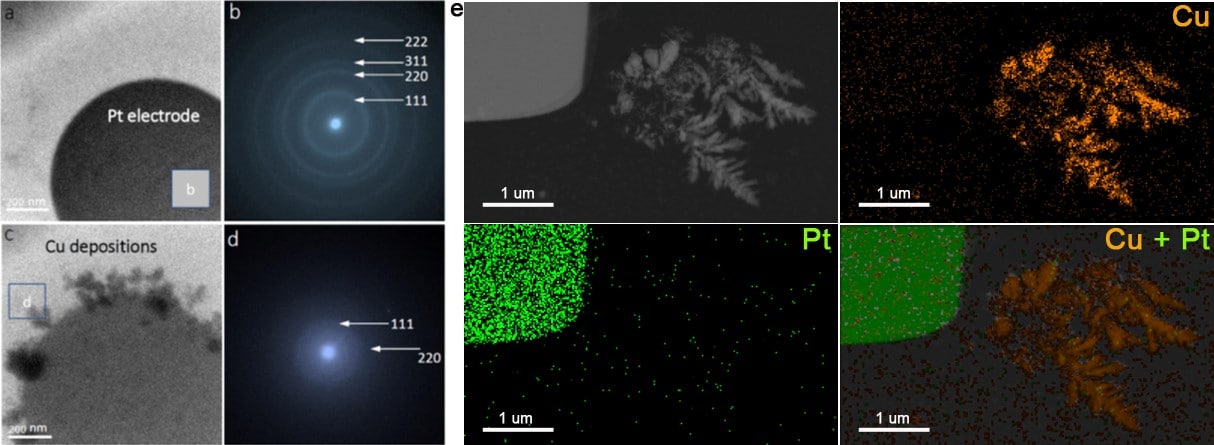
Figure 4. TEM images of (a) the Pt electrode and (c) the Cu dendrites on the electrode, and (b, d) the corresponding SAED patterns in the liquid phase (e) HAADF-STEM EDX elemental mapping, showing the spatial distribution of the Cu dendrites and the Pt electrode in the electrolyte.
Conclusion
Using a transmission electron microscope (TEM), an advanced sample holder and flow cell, and precise pressure-based flow controls, we demonstrated how to use a complete experimental setup to observe and characterize copper electrodeposition in liquid phase TEM.
The main innovation of this design is the controlled flow achieved by integrating microfluidics for TEM. This design ensures that the liquid is forced to flow between the chips and through the imaging area, as this is the only route for the liquid to reach the output. The direct connection of the inlet tube to the microfluidic channel of the chip allows precise control of flow direction and velocity. As a result, the reagents are guided directly to the imaging zone, and the cell can be flushed of reacted species. Finally, this configuration ensures that all liquid exiting the zone has experienced the same environmental and temperature conditions.
References
1. De Yoreo, J. J. & Sommerdijk, N. A. J. M. Investigating materials formation with liquid-phase and cryogenic TEM. Nat. Rev. Mater. 1, (2016).
2. Hodnik, N., Dehm, G. & Mayrhofer, K. J. J. Importance and Challenges of Electrochemical in Situ Liquid Cell Electron Microscopy for Energy Conversion Research. Acc. Chem. Res. 49, 2015–2022 (2016).
3. Smeets, P. J. M., Cho, K. R., Kempen, R. G. E., Sommerdijk, N. A. J. M. & De Yoreo, J. J. Calcium carbonate nucleation driven by ion binding in a biomimetic matrix revealed by in situ electron microscopy. Nat. Mater. 14, 394–399 (2015).
4. Sugi, H. et al. Dynamic electron microscopy of ATP-induced myosin head movement in living muscle thick filaments. Proc. Natl. Acad. Sci. U. S. A. 94, 4378–4382 (1997).
5. Mirsaidov, U. M., Zheng, H., Casana, Y. & Matsudaira, P. Imaging protein structure in water at 2.7 nm resolution by transmission electron microscopy. Biophys. J. 102, L15–L17 (2012).
6. Peckys, D. B., Korf, U., Wiemann, S. & De Jonge, N. Liquid-phase electron microscopy of molecular drug response in breast cancer cells reveals irresponsive cell subpopulations related to lack of HER2 homodimers. Mol. Biol. Cell 28, 3193–3202 (2017).
7. Ahmad, N., Wang, G., Nelayah, J., Ricolleau, C. & Alloyeau, D. Exploring the Formation of Symmetric Gold Nanostars by Liquid-Cell Transmission Electron Microscopy. Nano Lett. 17, 4194–4201 (2017).
8. Wang, C. M. et al. In situ transmission electron microscopy and spectroscopy studies of interfaces in Li ion batteries: Challenges and opportunities. J. Mater. Res. 25, 1541–1547 (2010).
9. Williamson, M. J., Tromp, R. M., Vereecken, P. M., Hull, R. & Ross, F. M. Dynamic microscopy of nanoscale cluster growth at the solid-liquid interface. Nat. Mater. 2, 532–536 (2003).
10. van Omme, J. T. et al. Liquid phase transmission electron microscopy with flow and temperature control. J. Mater. Chem. C (2020) doi:10.1039/d0tc01103g